
Creating a Quick Analysis Task
Logs contain information such as system performance and business status. For example, the frequency of keyword ERROR indicates the system health, and the frequency of keyword BUY indicates the business activity. You can use the quick analysis function to query specified log keywords. LTS collects statistics on the keywords and generates metric data, so that you can learn about the system performance and business in real time.
- The quick analysis function rapidly samples field value distributions without analyzing all data. The default number of samples is 100,000, with a maximum of 10 million. The more samples taken, the slower the analysis process. You can specify the number of samples for quick analysis on the Index Settings tab page. For details, see Configuring Log Indexing.
- Logs can be filtered by query time and criteria for analysis.
Quick analysis is to analyze the logs queried by query statements. When the number of queried logs is 0, no result is displayed for quick analysis.
- Quick analysis can be used to generate query statements.
You can click an analysis result to automatically generate a query statement, query logs, and generate a new quick analysis.
- If quick analysis is not enabled within the analysis time range, a field does not exist, or a field value is null, the analysis result of the field is null.
- When you click null to add a string field to the search box, Field : "null"OR NOT Field : * will be displayed.
- When you click null to add a float or long field to the search box, NOT Field : * will be displayed.
- If quick analysis is not enabled, the column-store data used for analysis is not stored, and the analysis result is null. In this case, log search is meaningless and no log may be matched.
Prerequisites
- Quick analysis is conducted on fields extracted from structured logs. Ensure that logs have been reported, structuring has been complete, and indexing has been configured before you create a quick analysis task. For details, see Using ICAgent to Collect Host Logs and Configuring Log Indexing.
- If you have not configured ICAgent structuring parsing when configuring log ingestion to LTS, you can configure ICAgent or cloud configuring parsing for the target log stream separately. ICAgent structuring parsing is recommended. For details, see Configuring ICAgent Structuring Parsing.
Creating a Quick Analysis Task
Quick analysis is performed on a per-log-stream basis. You can create a quick analysis task as follows:
- Log in to the LTS console. The Log Management page is displayed by default.
- Click the target log group or stream to access the log details page.
- On the Log Search tab page, click
 next to Quick Analysis to go to the Index Settings tab page. Under Index Fields, click Auto Configure to generate index fields automatically. Enable quick analysis for these fields.
Figure 1 Quick analysis
next to Quick Analysis to go to the Index Settings tab page. Under Index Fields, click Auto Configure to generate index fields automatically. Enable quick analysis for these fields.
Figure 1 Quick analysis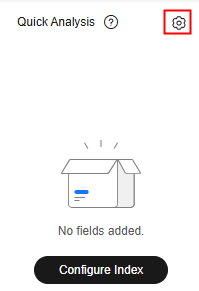
- Click OK. The quick analysis task is created.
- Enter a field name in the search box below Quick Analysis. The search results will then be displayed, helping you quickly locate the target field.
- abc displayed in front of a field indicates that the field is of the string type.
- 1.2 displayed in front of a field indicates that the field is of the float type.
- 123 displayed in front of a field indicates that the field is of the long type.
- The maximum length of a field for quick analysis is 2,000 bytes.
- The quick analysis field area displays the first 100 records.
- The number of sampled fields are displayed.
- Click
 to view the charts generated. For fields of the string type, the field distribution and intelligent aggregation timeline is displayed. For fields of the long and float types, only the intelligent aggregation timeline chart is displayed. Click a chart to view details.
Figure 2 String field chart
to view the charts generated. For fields of the string type, the field distribution and intelligent aggregation timeline is displayed. For fields of the long and float types, only the intelligent aggregation timeline chart is displayed. Click a chart to view details.
Figure 2 String field chart
- Click the field distribution chart or intelligent aggregation timeline to access the Log Analysis tab page and generate the corresponding SQL query statement. In this way, you can check the distribution and change trend of field values more intuitively. For details, see Analyzing Logs.
- Set whether to hide or display fields.
- To hide a field, click
 next to the field.
 - To hide all fields, click
 next to Fields.
 - To display a hidden field, click
 next to the field.
 - To display all fields, click
 next to Hidden Fields.
- To hide a field, click
Secondary Analysis
The quick analysis supports secondary analysis of float and long fields.
Click Max, Min, Avg, and Sum under the target field to quickly collect the maximum, minimum, average, and sum values.
Feedback
Was this page helpful?
Provide feedbackThank you very much for your feedback. We will continue working to improve the documentation.See the reply and handling status in My Cloud VOC.
For any further questions, feel free to contact us through the chatbot.
Chatbot


