Updated on 2024-05-16 GMT+08:00

Viewing Container Asset Fingerprints

HSS can collect container asset fingerprints, including container clusters, services, workloads, accounts, ports, and processes. You can centrally check container asset information and detect risky assets in a timely manner based on the container fingerprints. This section describes how to view collected container asset information.

Constraints

  • Only the HSS container edition supports the container fingerprint function.
  • Only Linux is supported.

Viewing Asset Fingerprints Data of All Containers

  1. Log in to the management console.
  2. In the upper left corner of the page, select a region, click , and choose Security & Compliance > HSS.
  3. Choose Asset Management > Container Fingerprints > Asset Fingerprints. On the Asset Fingerprints page that is displayed, view the fingerprint data of all containers.

    If you find risky assets after counting, remove them in a timely manner. Common high-risk ports are listed in the High-risk port list. You are advised to handle the ports as follows:

    • If HSS detects open high-risk ports or unused ports, check whether they are really used by your services. If they are not, disable them. For dangerous ports, you are advised to further check their program files, and delete or isolate their source files if necessary.
    • If a detected high-risk port is actually a normal port used for services, you can ignore it. Ignored alarms will neither be recorded as unsafe items and nor trigger alarms.

    If your servers are managed by enterprise projects, you can select the target enterprise project to view or operate the asset and detection information.

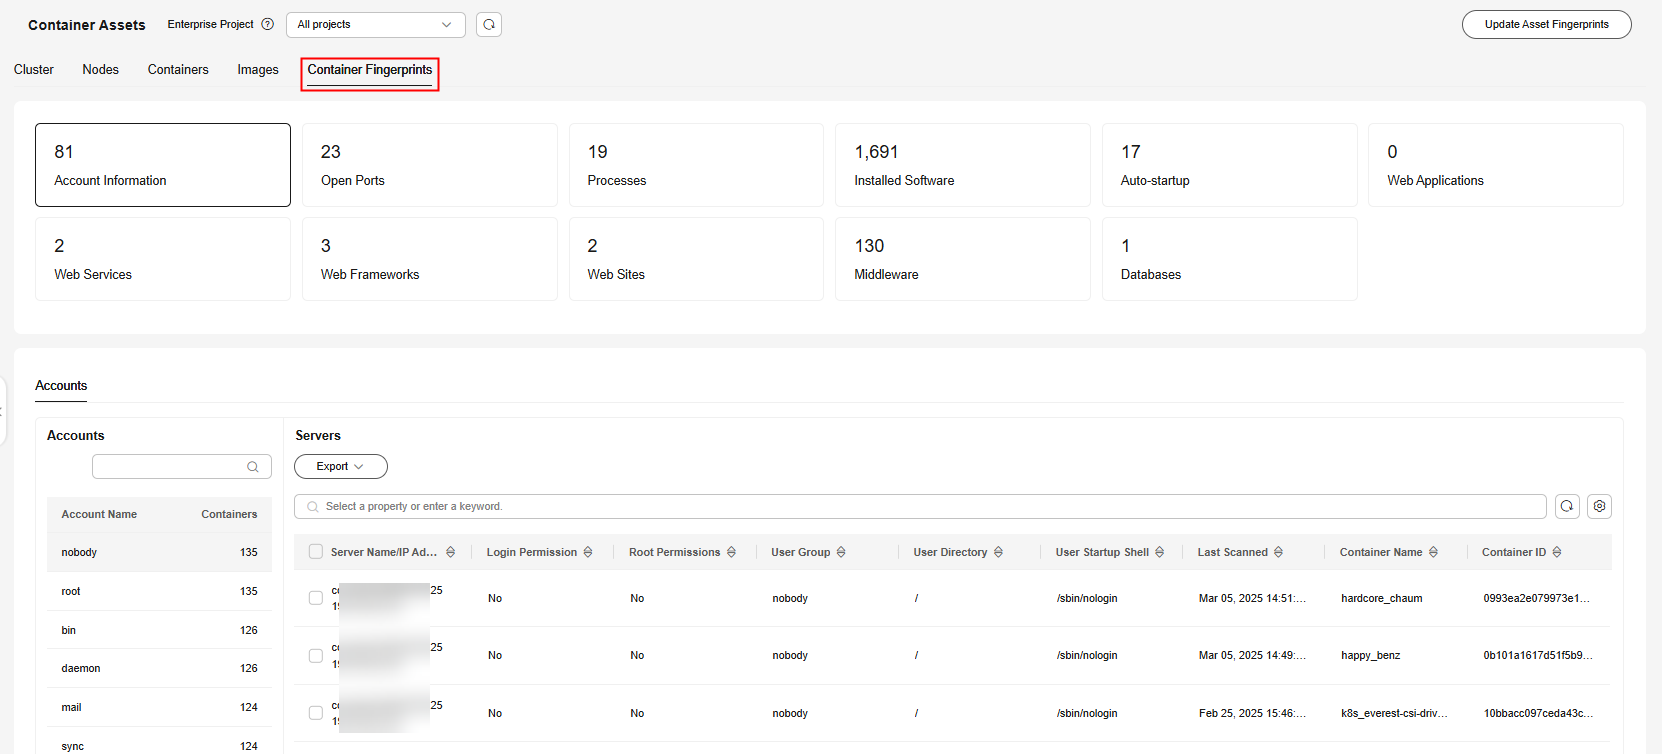
    Figure 1 Viewing container assets
    Table 1 Container asset fingerprints

    Item

    Description

    Automatic Detection Period

    Account Information

    Check and manage all accounts on your containers to keep them secure.

    Real-time account information includes the account name, number of servers, server name, IP address, login permission, root permission, user group, user directory, shell started by the user, container name, container ID, and the last scan time.

    Automatic check every hour

    Open Ports

    Check open ports on your containers, including risky and unknown ports.

    You can easily find high-risk ports on containers by checking local ports, protocol types, server names, IP addresses, statuses, PIDs, and program files.

    • Manually disabling high-risk ports

      If dangerous or unnecessary ports are found enabled, check whether they are mandatory for services, and disable them if they are not. For dangerous ports, you are advised to further check their program files, and delete or isolate their source files if necessary.

      It is recommended that you handle the ports with the Dangerous risk level promptly and handle the ports with the Unknown risk level based on the actual service conditions.

    • Ignore risks: If a detected high-risk port is actually a normal port used for services, you can ignore it. The port will no longer be regarded risky or generate alarms.

    Automated check every 30 seconds

    Processes

    Check processes on your containers and find abnormal processes.

    You can easily identify abnormal processes on your containers based process paths, server names, IP addresses, startup parameters, startup time, users who run the processes, file permissions, PIDs, and file hashes.

    If a suspicious process has not been detected in the last 30 days, its information will be automatically deleted from the process list.

    Automatic check every hour

    Installed Software

    Check and manage all software installed on your containers, and identify insecure versions.

    You can check real-time and historical software information to determine whether the software is risky.

    • Real-time software information includes the software name, number of servers, server names, IP addresses, software versions, software update time, and the last scan time.
    • Historical software change records include the server names, IP addresses, change statuses, software versions, software update time, and the last scan time.

    Automatic check every day

    Auto-startup

    Check for auto-started items and quickly locate Trojans.

    Real-time information about auto-started items includes their names, types (auto-started service, startup folder, pre-loaded dynamic library, Run registry key, or scheduled task), number of servers, server names, IP addresses, paths, file hashes, users, container name, container ID, and the last scan time.

    Automatic check every hour

    Websites

    You can check statistics about web directories and sites that can be accessed from the Internet. You can view the directories and permissions, access paths, external ports, certificate information (to be provided later), and key processes of websites.

    Once a week (04:10 a.m. every Monday)

    Web Framework

    You can check statistics about frameworks used for web content presentation, including their versions, paths, and associated processes.

    Once a week (04:10 a.m. every Monday)

    Middleware

    You can also check information about servers, versions, paths, and processes associated with middleware.

    Once a week (04:10 a.m. every Monday)

    Web Services

    You can check details about the software used for web content access, including versions, paths, configuration files, and associated processes of all software.

    Once a week (04:10 a.m. every Monday)

    Web Applications

    You can check details about software used for web content push and release, including versions, paths, configuration files, and associated processes of all software.

    Once a week (04:10 a.m. every Monday)

    Databases

    You can check details about software that provides data storage, including versions, paths, configuration files, and associated processes of all software.

    Once a week (04:10 a.m. every Monday)

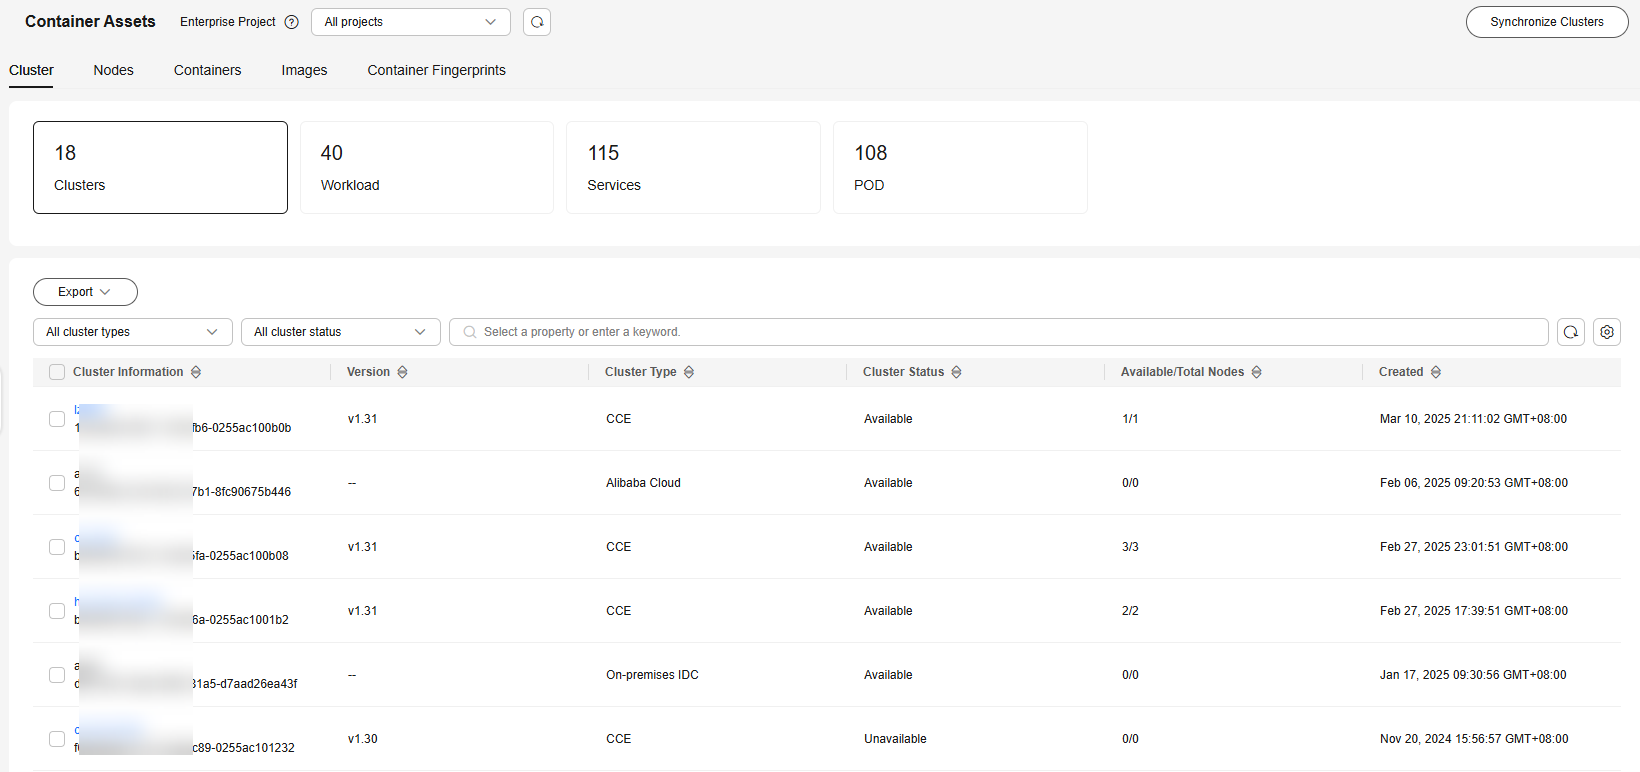
    Clusters

    Collect statistics on and display cluster details. You can view the type, node, version, and status of all clusters.

    -

    Services

    Collect statistics on and display details about services and breakpoints. You can view information about all services, such as namespaces and clusters to which the services belong.

    -

    Workloads

    Collect statistics on and display details about workloads (StatefulSets, deployments, DaemonSets, normal jobs, cron jobs, and container groups). You can view the status, number of instances, and namespace of all workloads.

    -

    Pods

    Collect statistics on and display container instance details. You can view the status, POD, and cluster of all container instances.

    -

Viewing Asset Fingerprint Data of a Single Container

  1. Log in to the management console.
  2. In the upper left corner of the page, select a region, click , and choose Security & Compliance > HSS.
  3. In the navigation pane, choose Asset Management > Servers & Quota. Click the Servers tab.

    If your servers are managed by enterprise projects, you can select an enterprise project to view or operate the asset and scan information.

  4. Click the name of the target server. On the server details page that is displayed, click the Asset Fingerprints > Containers tab.
  5. Click a fingerprint in the fingerprint list to view its asset information.

Viewing Cluster Information

  1. Log in to the management console.
  2. In the upper left corner of the page, select a region, click , and choose Security & Compliance > HSS.
  3. In the navigation pane, choose Asset Management > Container Fingerprints.
  4. Choose Clusters and click Synchronize in the upper left corner.
  5. Last Synchronized indicates the CCE cluster, service, workload, and container data is synchronized successfully.
  6. On the Clusters page, view cluster information.

    The Clusters page displays the cluster name, type, node, version, creation time, and status.

    • Searching for the target cluster

      You can enter information such as the cluster name and status in the search box and click to search for the target cluster.

    • Viewing details about the target cluster
      1. Click the name of the target cluster to go to the CCE console.
      2. On the CCE console, view basic cluster information and network information.

Viewing Services

  1. Log in to the management console.
  2. In the upper left corner of the page, select a region, click , and choose Security & Compliance > HSS.
  3. In the navigation pane, choose Asset Management > Container Fingerprints.
  4. Choose Clusters and click Synchronize in the upper left corner.
  5. Last Synchronized indicates the CCE cluster, service, workload, and container data is synchronized successfully.
  6. On the Services tab page, view the information.

    The page displays the service name, endpoint name, access mode, service IP address, namespace, cluster, and creation time.

    • Searching for a service

      You can enter information such as the service name and access mode in the search box and click to search for the service.

    • Viewing details about a service

      Click the name of a service. On the service details page that is displayed, you can view the selector, tag, and port of the service.

Viewing Endpoints

  1. Log in to the management console.
  2. In the upper left corner of the page, select a region, click , and choose Security & Compliance > HSS.
  3. In the navigation pane, choose Asset Management > Container Fingerprints.
  4. Choose Clusters and click Synchronize in the upper left corner.
  5. Last Synchronized indicates the CCE cluster, service, workload, and container data is synchronized successfully.
  6. Choose Services > Endpoints. View endpoints information.

    The page displays the endpoint name, namespace, cluster, associated with service, service name, and creation time.

    • Searching for an endpoint

      You can enter information such as the endpoint name and namespace in the search box and click to search for the endpoint.

    • Viewing details about an endpoint

      Click the name of an endpoint. On the endpoint details page that is displayed, you can view the pod mapping and port information.

Viewing a Workload

  1. Log in to the management console.
  2. In the upper left corner of the page, select a region, click , and choose Security & Compliance > HSS.
  3. In the navigation pane, choose Asset Management > Container Fingerprints.
  4. Choose Clusters and click Synchronize in the upper left corner.
  5. Last Synchronized indicates the CCE cluster, service, workload, and container data is synchronized successfully.
  6. Click the Workloads tab.
  7. Select different workloads and view information.

    You can view information about Deployment, StatefulSets, DaemonSets, Jobs, Cron Jobs, and Pods. For details about the information items, see Workload information Items.

    You can enter information such as the workload name and cluster in the search box and click to search for the target workload.

    Table 2 Workload information

    Workload Type

    Item

    Deployment

    • Workload name
    • Status
    • Instances
    • Namespaces
    • Created
    • Image name
    • Cluster

    StatefulSets

    • Workload name
    • Status
    • Instances
    • Namespace
    • Created
    • Image name
    • Cluster

    DaemonSets

    • Workload name
    • Status
    • Instances
    • Namespace
    • Created
    • Image name
    • Cluster

    Jobs

    • Workload name
    • Status
    • Instances
    • Namespace
    • Created
    • Image name
    • Cluster

    Cron Jobs

    • Workload name
    • Status
    • Trigger
    • Running jobs
    • Namespace
    • Latest scheduled
    • Created
    • Image name
    • Cluster

    Pods

    • Name
    • Namespace
    • Cluster
    • Node
    • Pod IP address
    • POD IP
    • Status
    • Created

Viewing Container Instances

  1. Log in to the management console.
  2. In the upper left corner of the page, select a region, click , and choose Security & Compliance > HSS.
  3. In the navigation pane, choose Asset Management > Container Fingerprints.
  4. Choose Clusters and click Synchronize in the upper left corner.
  5. Last Synchronized indicates the CCE cluster, service, workload, and container data is synchronized successfully.
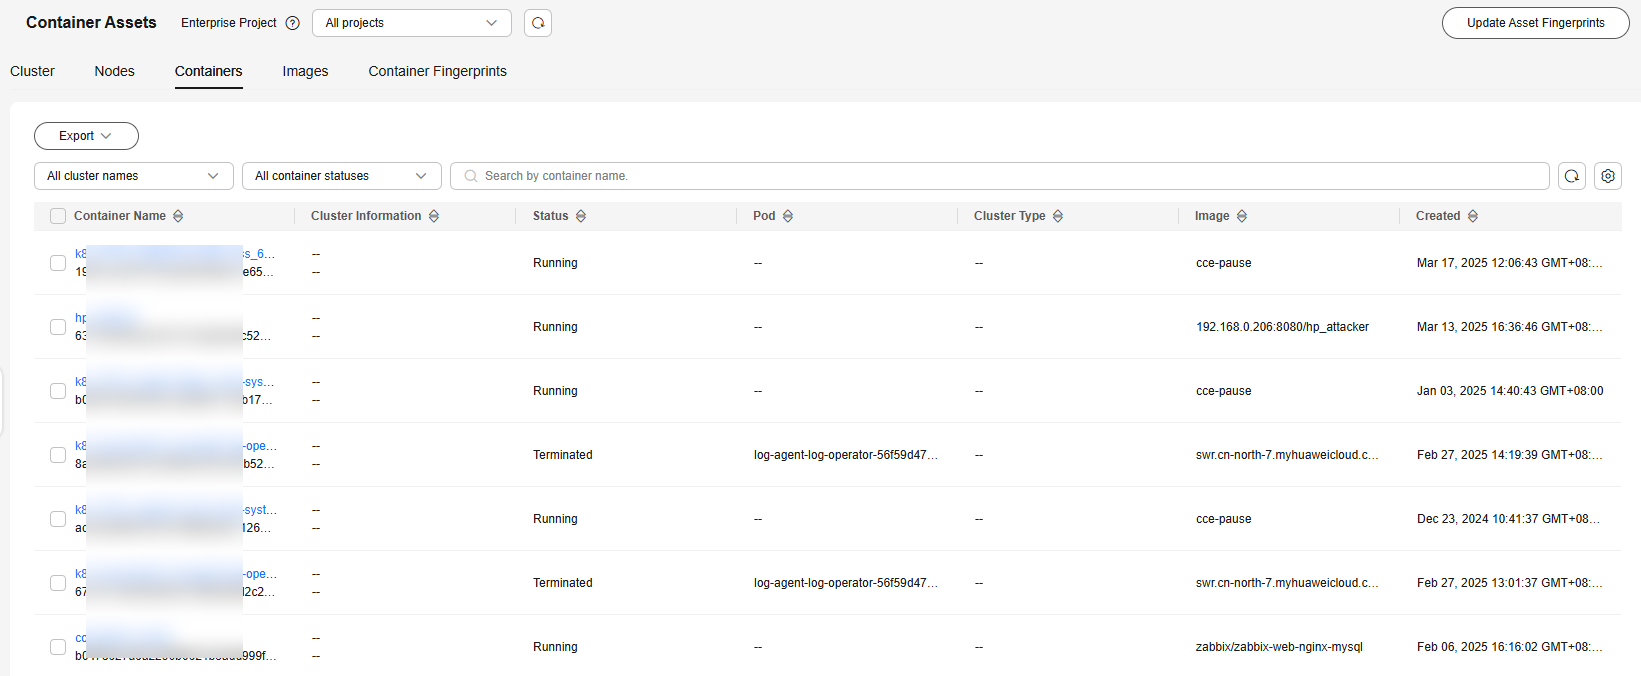
  6. Click the Container Instances tab.

    The container name, status, pod, cluster, creation time, and image name are displayed.

    • Searching for a container

      You can enter information such as the container name and status in the search box and click to search for the container.

    • Viewing details about a container

      Click the name of a container. On the container details page that is displayed, you can view the process, port, and mount path.