
Viewing and Downloading Slow Query Logs of a FlexusRDS Instance
Scenarios
Slow query logs record statements that exceed the long_query_time value (1 second by default). You can view log details and statistics to identify statements that are executing slowly and optimize the statements. You can also download slow query logs for service analysis.
Slow query logs generated within the last 7 days can be viewed.
FlexusRDS supports the following statement types:
- All statement types
- SELECT
- INSERT
- UPDATE
- DELETE
- CREATE
Parameter Description
|
Parameter |
Description |
|---|---|
|
long_query_time |
Specifies how many microseconds a SQL query has to take to be defined as a slow query log. The default value is 1s. When the execution time of an SQL statement exceeds the value of this parameter, the SQL statement is recorded in slow query logs. The recommended value is 1s. Note: The lock wait time is not calculated into the query time. |
|
log_queries_not_using_indexes |
Specifies whether to record the slow query without indexes. The default value is OFF. |
|
log_throttle_queries_not_using_indexes |
Limits the number of SQL statements without indexes per minute that can be written to the slow query log. The default value is 0. |
Viewing Log Details
- In the instance list, click the target instance name.
- Click the Logs tab. On the Slow Query Logs tab page, view details about slow SQL statements.

- You can view the slow query log records of a specified execution statement type or a specific time period.
- Only SELECT statements return the number of result rows. The number of result rows for the INSERT, UPDATE, DELETE, and CREATE statements is 0 by default.
- You can view slow query logs of a specified database name (which cannot contain any special characters). The database name supports only exact search.
- Slow query logs only record executed statements whose execution duration exceeds the threshold.
- The long_query_time parameter determines when a slow query log is recorded. However, changes to this parameter do not affect already recorded logs. If long_query_time is changed from 1s to 0.1s, FlexusRDS starts recording statements that meet the new threshold and still displays the previously recorded logs that do not meet the new threshold. For example, a 1.5s SQL statement that was recorded when the threshold was 1s will not be deleted now that the new threshold is 2s.
- Slow query logs are displayed in log loading mode. There is no upper limit on the number of log records displayed within the query time range, and the total number of log records is not displayed.
- If the length of a single line of an SQL statement exceeds 10 KB or the total number of lines exceeds 200, the SQL statement will be truncated. When you view slow query log details, the SQL statement may be incomplete after special processing and is for reference only.
Downloading a Slow Query Log
- In the instance list, click the target instance name.
- Click the Logs tab and click Download Logs on the right.
- In the displayed dialog box, click Slow Query Logs.
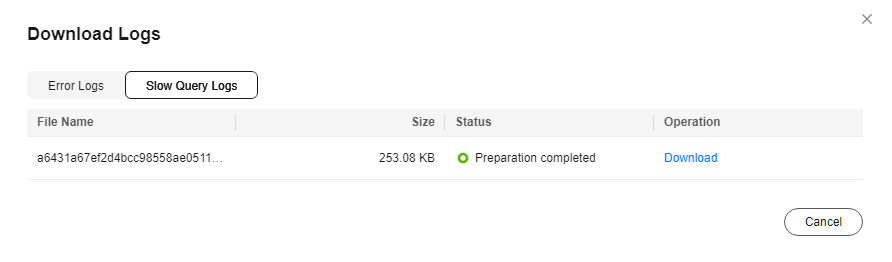
- Locate the log file whose status is Preparation completed and click Download in the Operation column.
Figure 1 Downloading a Slow Query Log
- The system automatically loads the downloading preparation tasks. The loading duration is determined by the log file size and network environment.
- When the log is being prepared for download, the log status is Preparing.
- When the log is ready for download, the log status is Preparation completed.
- If the preparation for download fails, the log status is Abnormal.
Logs in the Preparing or Abnormal status cannot be downloaded.
- Only logs no more than 40 MB can be downloaded directly from this page. The time range is calculated from the time you download the logs back to the time when the accumulated file size reaches 40 MB.
- It is impossible to generate a log file much larger than 40 MB, like 100 MB or 200 MB. If a log file that is a little larger than 40 MB is required, use OBS Browser+ to download it by referring to Method 1: Using OBS Browser+.
- The download link is valid for 5 minutes. After the download link expires, a message is displayed indicating that the download link has expired. If you need to redownload the log, click OK.
- The downloaded logs contain only the logs of the primary node.
- The system automatically loads the downloading preparation tasks. The loading duration is determined by the log file size and network environment.
Feedback
Was this page helpful?
Provide feedbackThank you very much for your feedback. We will continue working to improve the documentation.See the reply and handling status in My Cloud VOC.
For any further questions, feel free to contact us through the chatbot.
Chatbot


