Graph Instance O&M Monitoring
GES offers a multi-dimensional O&M monitoring interface that guarantees the smooth operations of graph instances. This feature gathers, monitors, and analyzes disk, network, and OS metrics utilized by graph instances, along with key cluster performance metrics. It promptly identifies significant database faults and performance issues and provides recommendations to optimize and resolve them.

- The graph instance O&M monitoring panel supports only memory edition graphs of version 2.3.17 or later and database edition graphs of version 2.4.8 or later.
- The ten-thousand-edge size is for development learning and does not support the O&M monitoring panel.
O&M Monitoring Page
- Log in to the GES management console. In the navigation pane on the left, choose Graph Management.
- In the graph list, locate the target graph instance, click More in the Operation column, and select View Metric to access the Instance Overview page. For details about monitoring metrics, see Monitoring Metrics.
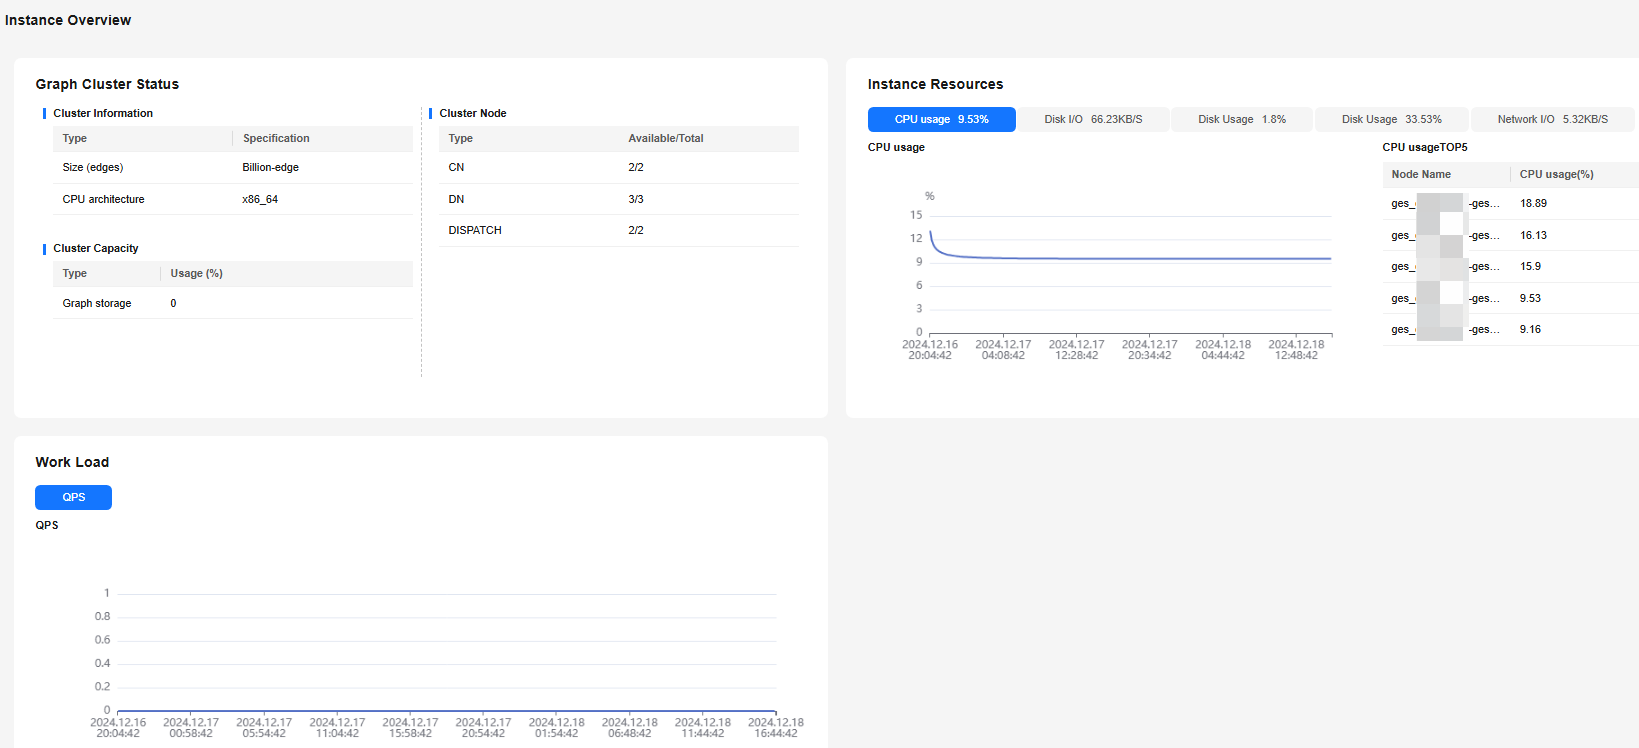
Figure 1 Instance Overview page

Instance Overview
On the Instance Overview page of a graph instance, you can check the graph instance status, real-time resource consumption, and service workload. The functions of these areas are as follows:
- Graph Cluster Status
In this area, you can check the basic information, cluster capacity, and number of requests of the current graph instance.
- Cluster Information: includes graph size, CPU architecture, and more.
- Cluster Capacity: includes the number of used and total vertices and edges, as well as the usage.
- Cluster Node: includes the number of available nodes versus the total number of nodes for each type.
- Cluster Request Statistics (only available for the memory edition): includes the number of waiting read requests, running read requests, waiting write requests, and running write requests.
Figure 2 Graph Cluster Status
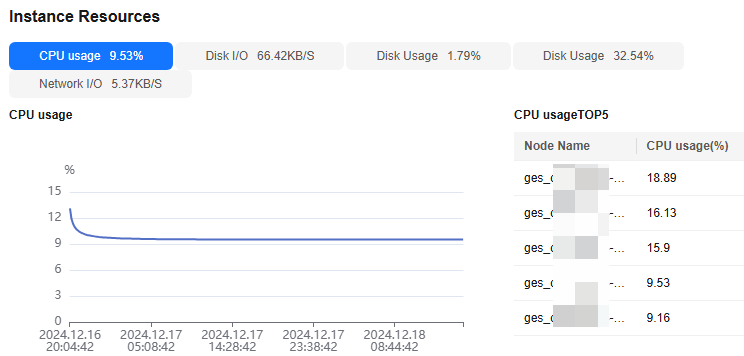
- Instance Resources
In this area, you can check the resource usage of the current instance, including the CPU usage, disk I/O, disk usage, memory usage, and network I/O. You can click a resource metric to view its change trend in the last 72 hours and the top 5 nodes with the highest usage of the resource at the current time.
Figure 3 Instance Resources
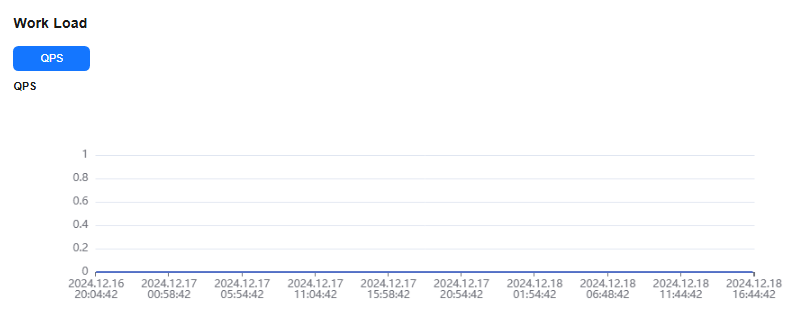
- Workload
In this area, you can check the change trend of the database service load metric QPS in the last 72 hours.
Figure 4 Workload
Feedback
Was this page helpful?
Provide feedbackThank you very much for your feedback. We will continue working to improve the documentation.See the reply and handling status in My Cloud VOC.
For any further questions, feel free to contact us through the chatbot.
Chatbot


