Viewing Monitoring Metrics of a FlexusX Instance
Scenarios
Huawei Cloud provides Cloud Eye to help you monitor FlexusX instances. You can view the metrics of each FlexusX instance on the management console.
It takes a period of time to transmit and display monitored data. The statuses of FlexusX instances displayed on the Cloud Eye console are obtained 5 to 10 minutes before. You can obtain the monitored data of a newly created FlexusX instance 5–10 minutes later.
Prerequisites
- The FlexusX instance is running properly.
Cloud Eye does not display the monitoring data for a stopped, faulty, or deleted FlexusX instance. After such a FlexusX instance restarts or recovers, the monitoring data is available on Cloud Eye.

Cloud Eye stops monitoring FlexusX instances that remain in the Stopped or Faulty state for 24 hours and removes them from the monitoring list. However, the alarm rules configured for such FlexusX instances are not automatically deleted.
- Alarm rules have been configured on Cloud Eye for the FlexusX instance.
The monitoring data is unavailable for the FlexusX instances without alarm rules configured on Cloud Eye. For details, see Configuring Alarm Rules for a FlexusX Instance.
- The FlexusX instance has been running for at least 10 minutes.
The monitoring data and graphics are not available for a new instance until the instance has been running for a certain period.
Procedure
- Log in to the FlexusX console. In the upper left corner, click
 and select a region.
 - Click the name of the target FlexusX instance.
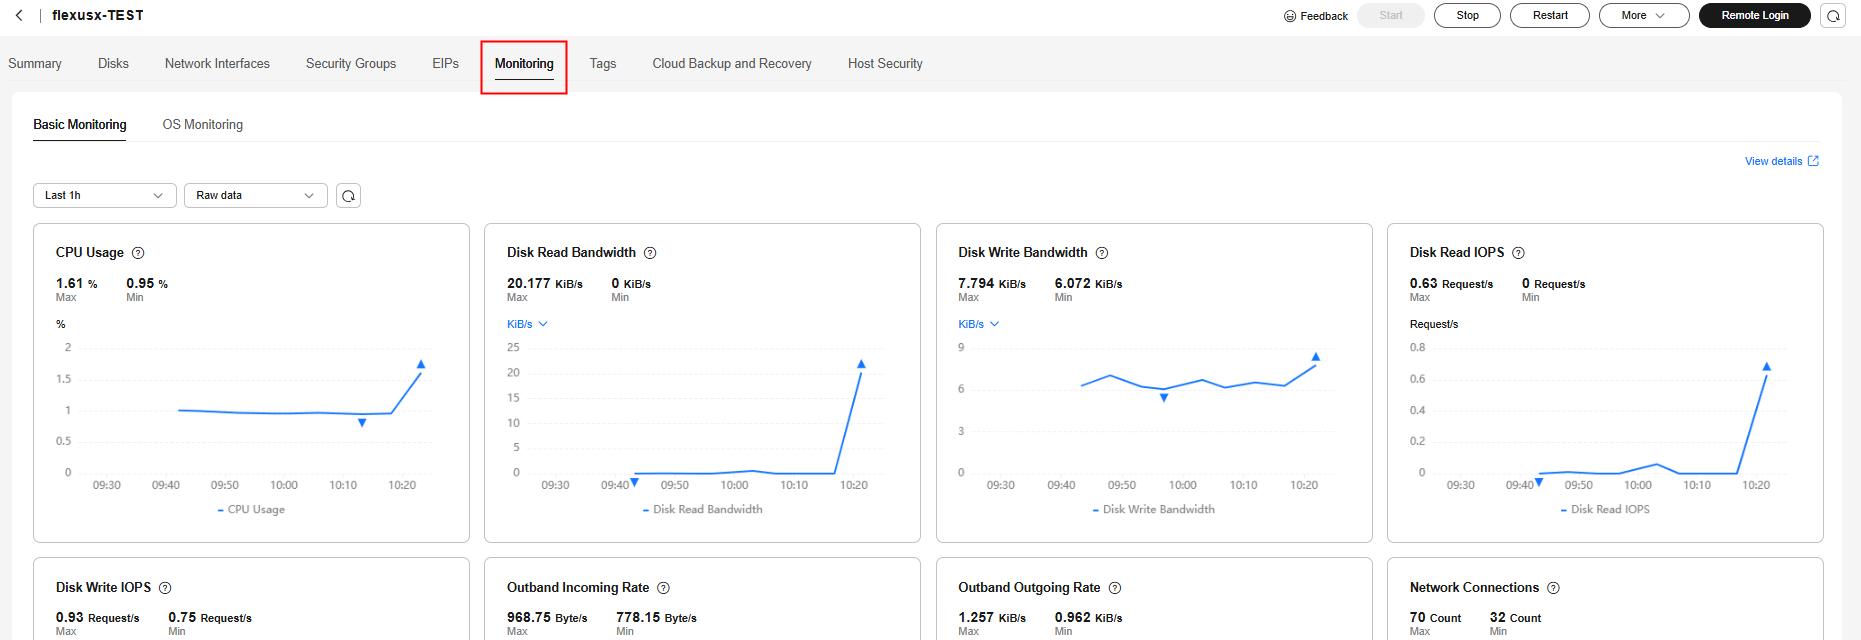
- Click the Monitoring tab to view the monitoring data. Figure 1 Viewing monitoring details

- You can view the data curves of the last 15 minutes, last 30 minutes, last 1 hour, last 2 hours, last 3 hours, last 12 hours, and last 1 day.
- You can select a metric value type, including Raw Value, Average Value, Max., Min., and Sum.
- Raw Value is the metric data that is not processed or converted.
- Average Value is the value calculated by averaging raw data over a rollup period.
- Max. is the highest value observed during a rollup period.
- Min. is the lowest value observed during a rollup period.
- Variance is the difference between each data point in the original value and the average value within a rollup period.
- Sum is the sum of raw data during a rollup period.
Rollup is a process where Cloud Eye aggregates the maximum, minimum, average, sum, or variance value of raw data sampled for different periods. This process repeats for each subsequent period. Each period is called a rollup period. A rollup period can be 1 minute, 5 minutes, 20 minutes, and 1 hour. Select it based on your service requirements.
- For details about metrics, see Basic ECS Metrics, OS Monitoring Metrics Supported by ECSs with the Agent Installed and Process Monitoring Metrics Supported by ECSs with the Agent Installed.
Helpful Links
Feedback
Was this page helpful?
Provide feedbackThank you very much for your feedback. We will continue working to improve the documentation.See the reply and handling status in My Cloud VOC.
For any further questions, feel free to contact us through the chatbot.
Chatbot


