
Viewing Monitoring Metrics of a FlexusRDS for MySQL Instance
Scenarios
This section describes how to view monitoring metrics of FlexusRDS for MySQL instances and configure alarm rules. You can customize objects to be monitored and notification policies so that you can closely monitor your instances.
Viewing Metrics
- In the instance list, click the target instance name.
- Click the Monitoring tab and view the monitoring metrics of the instance. Figure 1 Metrics
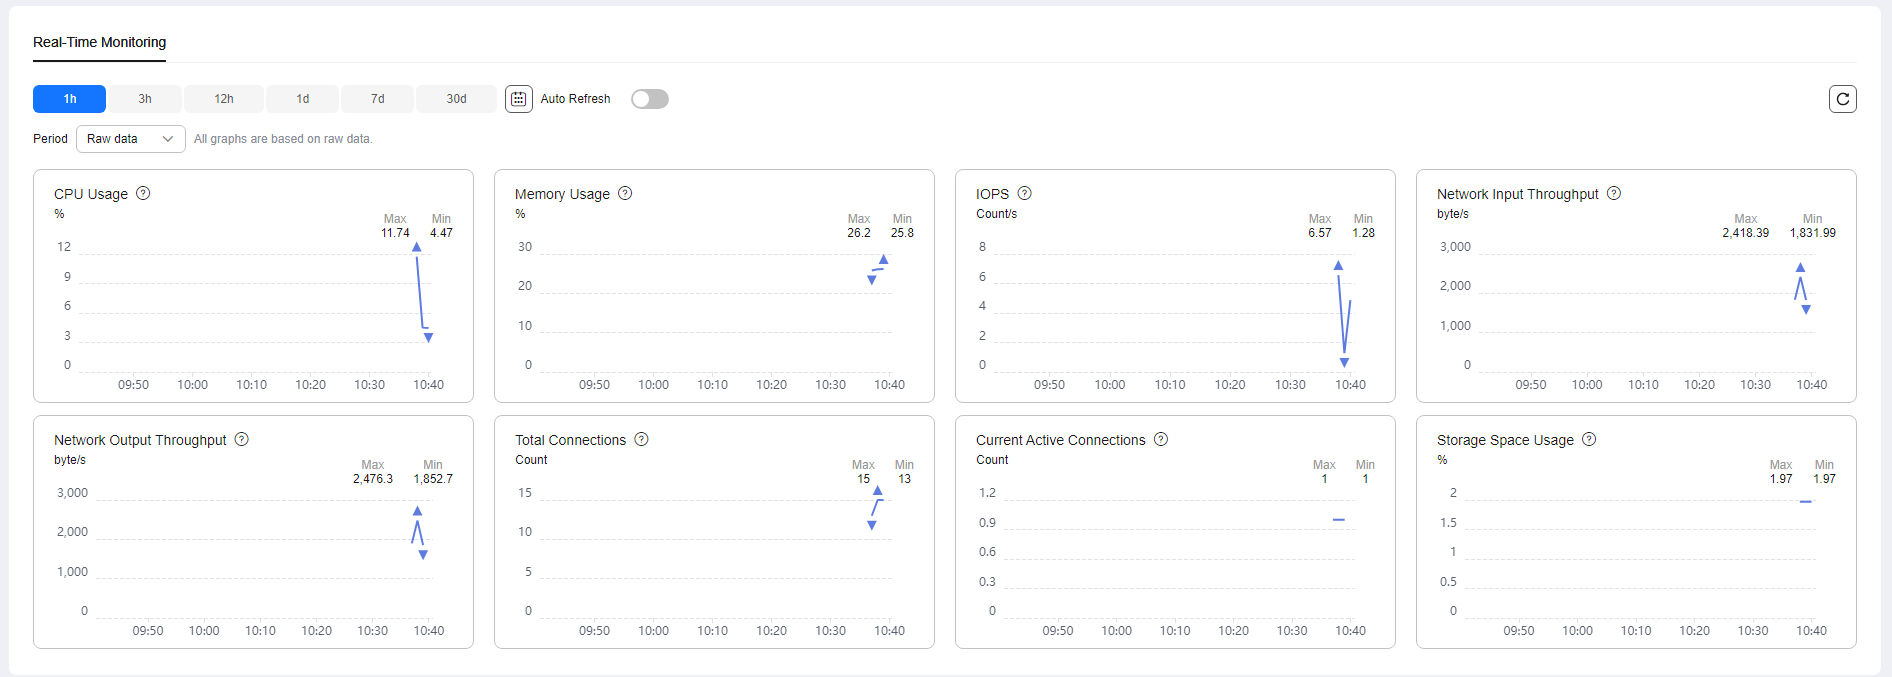
Table 1 Supported metrics Name
Description
Value Range
Monitored Object
Monitoring Interval (Raw Data)
CPU Usage
CPU usage of the monitored object
0-100%
FlexusRDS for MySQL instance
1 minute
Memory Usage
Memory usage of the monitored object
0-100%
FlexusRDS for MySQL instance
1 minute
Storage Space Usage
Storage usage of the monitored object
0-100%
FlexusRDS for MySQL instance
1 minute
IOPS
Average number of I/O requests processed by the system in a specified period
≥ 0 counts/s
FlexusRDS for MySQL instance
1 minute
Network Input Throughput
Incoming traffic in bytes per second
≥ 0 bytes/s
FlexusRDS for MySQL instance
1 minute
Network Output Throughput
Outgoing traffic in bytes per second
≥ 0 bytes/s
FlexusRDS for MySQL instance
1 minute
Total Connections
Total number of connections that attempt to connect to the MySQL server
≥ 0 counts
FlexusRDS for MySQL instance
1 minute
Current Active Connections
Number of connections that are not in the sleep state
≥ 0 counts
FlexusRDS for MySQL instance
1 minute
Configuring Alarm Rules
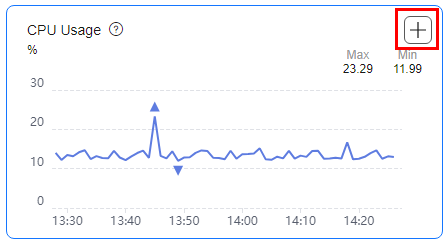
- On the metric card, click + to go to the page for configuring alarm rules. Figure 2 Selecting a metric
- On the Create Alarm Rule page, configure required parameters.
- Name: The system generates a random name for the alarm rule. You can change it as needed.
- Description: Add supplementary information about the rule.
- Alarm Policy: Specify the conditions for triggering an alarm. An alarm will be triggered if the metric data in the specified number of consecutive periods reaches the specified threshold.
- Alarm Notification: Specify whether to notify users when alarms are triggered. Notifications can be sent by email, text message, or HTTP/HTTPS message.
For details about how to configure alarm notification, see Creating an Alarm Rule in Cloud Eye User Guide.
- Click Create.
Feedback
Was this page helpful?
Provide feedbackThank you very much for your feedback. We will continue working to improve the documentation.See the reply and handling status in My Cloud VOC.
For any further questions, feel free to contact us through the chatbot.
Chatbot


