
Viewing Monitoring Metrics of a FlexusRDS for PostgreSQL Instance
Scenarios
This section describes how to view monitoring metrics of FlexusRDS for PostgreSQL instances and configure alarm rules. You can customize objects to be monitored and notification policies so that you can closely monitor your instances.
Viewing Metrics
- In the instance list, click the target instance name.
- Click the Monitoring tab and view the monitoring metrics of the instance. Figure 1 Metrics
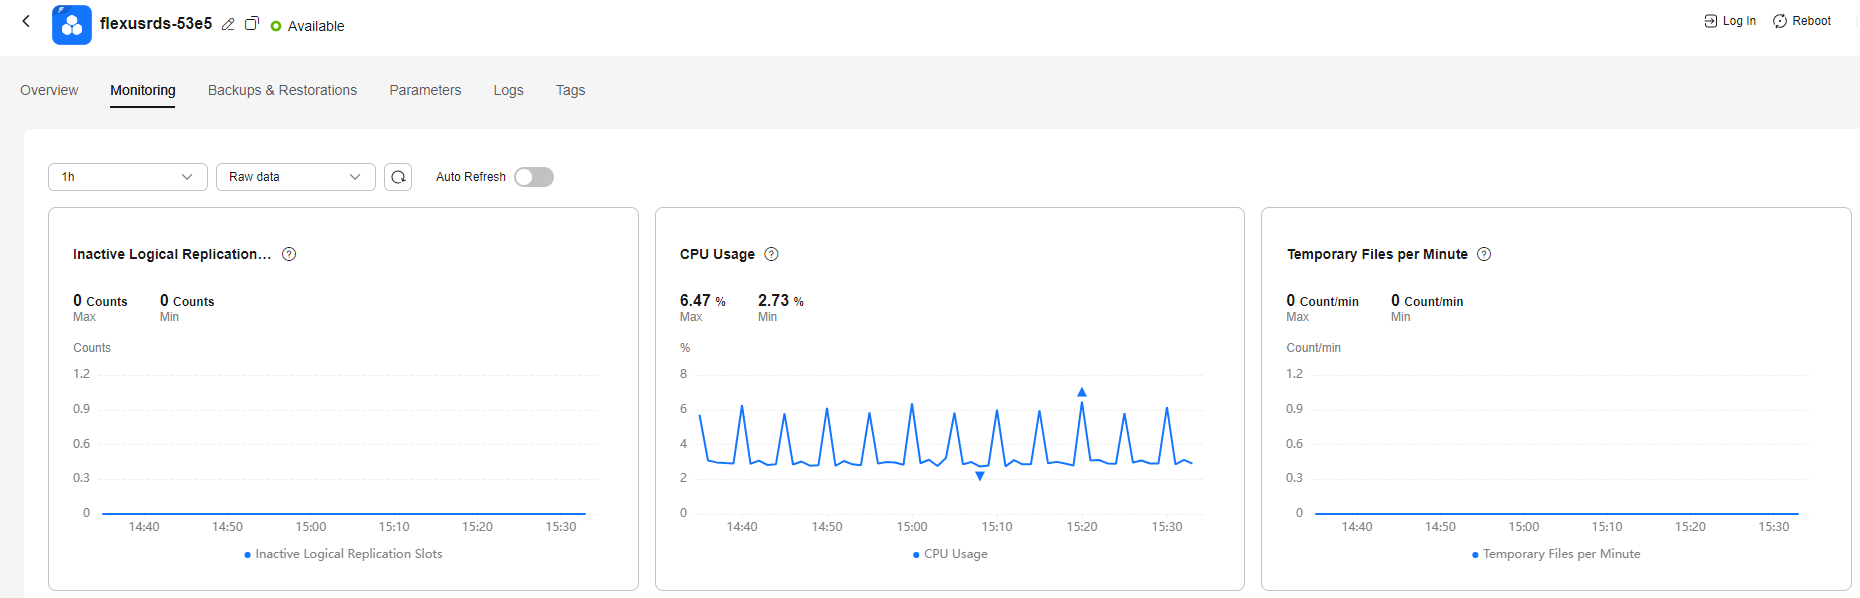
Table 1 Supported metrics Name
Description
Value Range
Monitored Object
Monitoring Interval (Raw Data)
Inactive Logical Replication Slots
Number of inactive logical replication slots
≥ 0
FlexusRDS for PostgreSQL instance
1 minute
CPU Usage
CPU usage of the monitored object
0-100%
FlexusRDS for PostgreSQL instance
1 minute
Temporary Files per Minute
Number of temporary files generated within 1 minute
≥ 0 Count/min
FlexusRDS for PostgreSQL instance
1 minute
Memory Usage
Memory usage of the monitored object
0-100%
FlexusRDS for PostgreSQL instance
1 minute
Temporary File Size per Minute
Size of temporary files generated within 1 minute
≥ 0 Byte/min
FlexusRDS for PostgreSQL instance
1 minute
IOPS
Average number of I/O requests processed by the system in a specified period
≥ 0 counts/s
FlexusRDS for PostgreSQL instance
1 minute
Synchronous Replication Blocking Time
Time during which synchronous replication between the primary and standby nodes is blocked
≥ 0s
FlexusRDS for PostgreSQL instance
1 minute
Network Input Throughput
Incoming traffic in bytes per second
≥ 0 bytes/s
FlexusRDS for PostgreSQL instance
1 minute
Stream Replication Status of Standby Instance or Read Replica
Stream replication status of the standby instance or a read replica. The value 0 indicates abnormal stream replication. A 1 indicates normal stream replication. A 2 means that this node is the primary instance.
Count
FlexusRDS for PostgreSQL instance
1 minute
Network Output Throughput
Outgoing traffic in bytes per second
≥ 0 bytes/s
FlexusRDS for PostgreSQL instance
1 minute
Inodes
Used data disk inodes
≥ 0 counts
FlexusRDS for PostgreSQL instance
5 minutes
Storage Space Usage
Storage usage of the monitored object
0-100%
FlexusRDS for PostgreSQL instance
1 minute
Transaction Logs Usage
Storage space usage of transaction logs
≥ 0 MB
FlexusRDS for PostgreSQL instance
1 minute
Replication Slot Usage
Storage space usage of replication slot files
≥ 0 MB
FlexusRDS for PostgreSQL instance
1 minute
Database Connections in Use
Number of database connections in use
≥ 0 counts
FlexusRDS for PostgreSQL instance
1 minute
Maximum Used Transaction IDs
Maximum number of transaction IDs that have been used
≥ 0 counts
FlexusRDS for PostgreSQL instance
1 minute
Transaction Logs Generation
Size of transaction logs generated per second
≥ 0 MB/s
FlexusRDS for PostgreSQL instance
1 minute
Oldest Replication Slot Lag
Lagging size of the most lagging replica in terms of WAL data received
≥ 0 MB
FlexusRDS for PostgreSQL instance
1 minute
Replication Lag
Replication lag delay
≥ 0 ms
FlexusRDS for PostgreSQL instance
1 minute
Connections in Use
Number of connections in use (excluding built-in connections used for monitoring and O&M)
≥ 0 Counts
FlexusRDS for PostgreSQL instance
1 minute
Active Connections of Users
Number of active connections used by users (excluding built-in active connections used for monitoring and O&M)
≥ 0 counts
FlexusRDS for PostgreSQL instance
1 minute
TPS
Average execution times of submitted and rollback transactions per second
≥ 0 counts/s
FlexusRDS for PostgreSQL instance
1 minute
Connection Usage
Percent of used PostgreSQL connections to the total number of connections
0-100%
FlexusRDS for PostgreSQL instance
1 minute
Active Connections
Number of active connections to a DB instance
≥ 0
FlexusRDS for PostgreSQL instance
1 minute
Idle Transaction Connections
Number of connections with idle transactions
≥ 0
FlexusRDS for PostgreSQL instance
1 minute
Operation Rows
Number of rows that are being inserted, deleted, updated, or queried
≥ 0
FlexusRDS for PostgreSQL instance
1 minute
Oldest Active Transaction Duration
Length of time since the start of the transaction that has been active longer than any other current transaction
≥ 0 ms
FlexusRDS for PostgreSQL instance
1 minute
Oldest Two-Phase Commit Transaction Duration
Length of time since the start of the transaction that has been prepared for two-phase commit longer than any other current transaction
≥ 0 ms
FlexusRDS for PostgreSQL instance
1 minute
Disk I/O Usage
I/O usage of disks The disk I/O usage is the percentage of the time that the disk processes I/O requests to the total time.
NOTE:If the disk I/O usage reaches 100%, data is being written to the disk during the statistical period. The disk performance is determined by multiple metrics, such as IOPS, disk throughput, and read/write latency.
0-100%
FlexusRDS for PostgreSQL instance
1 minute
Sessions Waiting for Locks
Number of sessions that are waiting for locks
≥ 0
FlexusRDS for PostgreSQL instance
1 minute
Swap-In Rate
Volume of data written from the swap partition to the memory per second
≥ 0 KB/s
FlexusRDS for PostgreSQL instance
1 minute
Swap-Out Rate
Volume of data written from the memory to the swap partition per second
≥ 0 KB/s
FlexusRDS for PostgreSQL instance
1 minute
Total Swap Size
Total size of the swap partition
≥ 0 MB
FlexusRDS for PostgreSQL instance
1 minute
Swap Usage
Usage of the swap partition
0-100%
FlexusRDS for PostgreSQL instance
1 minute
Maximum Database Age
Maximum age of the current database, which is the value of max(age(datfrozenxid)) in the pg_database table
≥ 0
FlexusRDS for PostgreSQL instance
1 minute
User-mode CPU Time Percentage
Percentage of time that the CPU is in user mode
0-100%
FlexusRDS for PostgreSQL instance
1 minute
Kernel-mode CPU Time Percentage
Percentage of time that the CPU is in kernel mode
0-100%
FlexusRDS for PostgreSQL instance
1 minute
Disk I/O Wait Time Percentage
Percentage of time that the CPU is waiting for disk I/O operations to complete
0-100%
FlexusRDS for PostgreSQL instance
1 minute
Read I/O Latency
Average latency (in milliseconds) of disks responding to read requests
≥ 0 ms
FlexusRDS for PostgreSQL instance
1 minute
Write I/O Latency
Average latency (in milliseconds) of disks responding to write requests
≥ 0 ms
FlexusRDS for PostgreSQL instance
1 minute
Read IOPS
Average number of read I/O requests processed by the system in a specified period
≥ 0 counts/s
FlexusRDS for PostgreSQL instance
1 minute
Write IOPS
Average number of write I/O requests processed by the system in a specified period
≥ 0 counts/s
FlexusRDS for PostgreSQL instance
1 minute
Number of SQL Statements Executed for More Than 1s
Number of slow SQL statements whose execution time is longer than 1s
≥ 0
FlexusRDS for PostgreSQL instance
1 minute
Number of SQL Statements Executed for More Than 3s
Number of slow SQL statements whose execution time is longer than 3s
≥ 0
FlexusRDS for PostgreSQL instance
1 minute
Number of SQL Statements Executed for More Than 5s
Number of slow SQL statements whose execution time is longer than 5s
≥ 0
FlexusRDS for PostgreSQL instance
1 minute
Number of SQL Statements Executed for More Than log_min_duration_statement
Number of slow SQL statements whose execution time is longer than the value of log_min_duration_statement. You can change the value of this metric as required.
≥ 0
FlexusRDS for PostgreSQL instance
1 minute
WAL Size
Size of WAL logs
≥ 0 GB
FlexusRDS for PostgreSQL instance
5 minutes
Audit Log Size
Size of audit logs
≥ 0 GB
FlexusRDS for PostgreSQL instance
5 minutes
Memory Hit Rate
Memory hit rate
≥ 0%
FlexusRDS for PostgreSQL instance
1 minute
Transactions Alive for More Than 1s
The number of long-running transactions that are kept alive for more than 1s
≥ 0
FlexusRDS for PostgreSQL instance
1 minute
Transactions Alive for More Than 3s
The number of long-running transactions that are kept alive for more than 3s
≥ 0
FlexusRDS for PostgreSQL instance
1 minute
Transactions Alive for More Than 5s
The number of long-running transactions that are kept alive for more than 5s
≥ 0
FlexusRDS for PostgreSQL instance
1 minute
Transactions Idle for More Than 1s
The number of long-running transactions that have been idle for more than 1s
≥ 0
FlexusRDS for PostgreSQL instance
1 minute
Transactions Idle for More Than 3s
The number of long-running transactions that have been idle for more than 3s
≥ 0
FlexusRDS for PostgreSQL instance
1 minute
Transactions Idle for More Than 5s
The number of long-running transactions that have been idle for more than 5s
≥ 0
FlexusRDS for PostgreSQL instance
1 minute
Two-Phase Transactions Running for More Than 1s
The number of long-running transactions that have been running for more than 1s in two phases
≥ 0
FlexusRDS for PostgreSQL instance
1 minute
Two-Phase Transactions Running for More Than 3s
The number of long-running transactions that have been running for more than 3s in two phases
≥ 0
FlexusRDS for PostgreSQL instance
1 minute
Two-Phase Transactions Running for More Than 5s
The number of long-running transactions that have been running for more than 5s in two phases
≥ 0
FlexusRDS for PostgreSQL instance
1 minute
Configuring Alarm Rules
- On the metric card, click + to go to the page for configuring alarm rules. Figure 2 Selecting a metric

- On the Create Alarm Rule page, configure required parameters.
- Name: The system generates a random name for the alarm rule. You can change it as needed.
- Description: Add supplementary information about the rule.
- Alarm Policy: Policy for triggering an alarm. An alarm is triggered when the metric configured for this alarm reaches the preset threshold in consecutive periods.
- Alarm Notification: Specify whether to notify users when alarms are triggered. Notifications can be sent by email, text message, or HTTP/HTTPS message.
For details about how to configure alarm notification, see Creating an Alarm Rule in Cloud Eye User Guide.
- Click Create.
Feedback
Was this page helpful?
Provide feedbackThank you very much for your feedback. We will continue working to improve the documentation.See the reply and handling status in My Cloud VOC.
For any further questions, feel free to contact us through the chatbot.
Chatbot


