
Updated on 2022-09-05 GMT+08:00
Viewing Traces on the CTS Console
Scenario
This section describes how to view operation records for the last 7 days on the CTS console.
Procedure
- Log in to the management console.
- Click
 in the upper left corner of the management console and select a region.

Select the same region as your application service.
- Click Service List, and choose Management & Deployment > Cloud Trace Service.
- In the navigation pane, choose Trace List.
- On the Trace List page, query traces based on a combination of the following querying dimensions:
- Trace Source: Select DMS.
- Resource Type: Select group, or queue.
- Search By: Select an option from the drop-down list.
When you select Trace name, you also need to select a specific trace name.
When you select Resource ID, you also need to select a specific resource ID.
When you select Resource name, you also need to select a specific resource name.
- Operator: Select a specific operator (a user other than tenant).
- Trace Status: Available options include All trace statuses, Normal, Warning, and Incident. You can only select one of them.
- Start time and end time: You can specify the time period to query traces.
- Click
 on the left of a trace to expand its details, as shown in Figure 1.
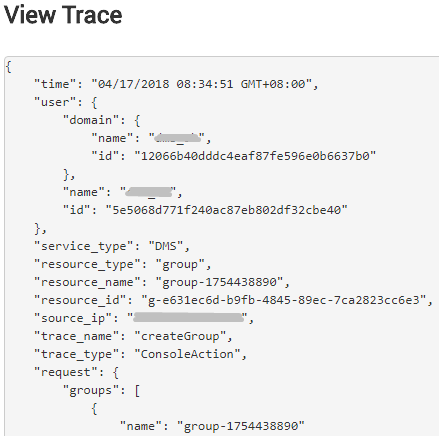
- Click View Trace in the Operation column. In the displayed View Trace dialog box, the trace structure details are displayed, as shown in Figure 2.

Parent topic: Auditing
Feedback
Was this page helpful?
Provide feedbackThank you very much for your feedback. We will continue working to improve the documentation.See the reply and handling status in My Cloud VOC.
The system is busy. Please try again later.
For any further questions, feel free to contact us through the chatbot.
Chatbot


