Help Center/ Document Database Service/ User Guide/ Logs/ Error Logs/ Viewing Error Logs on the DDS Console
Updated on 2025-09-09 GMT+08:00
Viewing Error Logs on the DDS Console
DDS log management allows you to view database-level logs, including warning- and error-level logs generated during database running, which help you analyze system problems.
Viewing and Exporting Log Details
- Log in to the management console.
- Click
 in the upper left corner and select a region and a project.
 - Click
 in the upper left corner of the page and choose Databases > Document Database Service.
 - On the Instances page, click the instance name.
- In the navigation pane on the left, choose Error Logs.
- On the displayed page, click Error Logs. Then, view the log details on the Log Details tab.
- For a cluster instance, you can view error logs of the dds mongos, shard, and config nodes. Figure 1 Viewing error logs of a cluster instance

- For a replica set instance, you can view the error logs of the primary, secondary, hidden nodes, and read replicas. Figure 2 Viewing error logs of a replica set instance

- For a single node instance, you can view error logs of the current node. Figure 3 Viewing error logs of a single-node instance

- You can view up to 2,000 error logs of a specified node type, at a specified level, and within a specified period.
- For a cluster instance, you can view error logs of the dds mongos, shard, and config nodes.
- On the Log Details tab, click Advanced Search. Figure 4 Advanced search

- Specify Keyword and click Search to view log information. Figure 5 Setting advanced search parameters

- To clear the parameter settings of Advanced Search, click Reset. Figure 6 Resetting advanced search parameters

- On the Log Details tab, click
 in the upper right corner of the log list to export log details.
 - View the .csv file exported to your local PC.
- Up to 2,000 log details can be exported at a time.
Downloading Logs
- Log in to the management console.
- Click
 in the upper left corner and select a region and a project.
 - Click
 in the upper left corner of the page and choose Databases > Document Database Service.
 - On the Instances page, click the Community Edition instance name.
- In the navigation pane on the left, choose Error Logs.
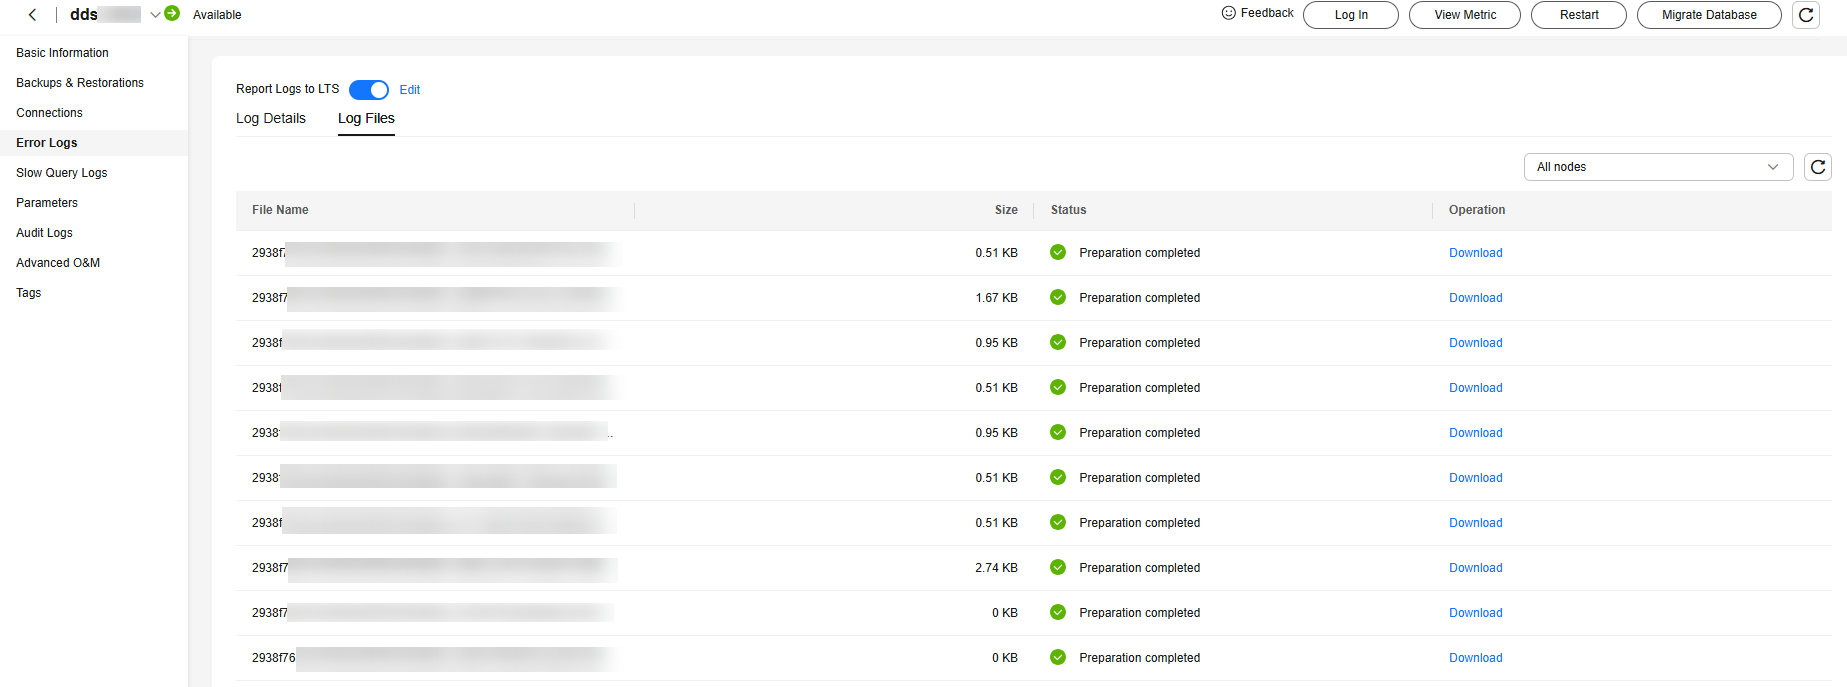
- On the Error Logs page, click the Log Files tab. Locate a log whose status is Preparation completed and click Download in the Operation column. Figure 7 Error Logs

- The system automatically loads the downloading preparation tasks. The time it takes to download the logs depends on the file size and on the network environment.
- During the downloading preparation, the log status is Preparing.
- Once the logs are ready for download, the log status changes to Preparation completed.
- If the downloading preparation fails, the log status is Abnormal.
- You can download only one log file from a node. The maximum size of a log file to be downloaded is 40 MB.
- The download link is valid for 15 minutes. After the download link expires, a message is displayed indicating that the download link has expired. To download the log, click OK.
- The system automatically loads the downloading preparation tasks. The time it takes to download the logs depends on the file size and on the network environment.
Parent topic: Error Logs
Feedback
Was this page helpful?
Provide feedbackThank you very much for your feedback. We will continue working to improve the documentation.See the reply and handling status in My Cloud VOC.
The system is busy. Please try again later.
For any further questions, feel free to contact us through the chatbot.
Chatbot


