
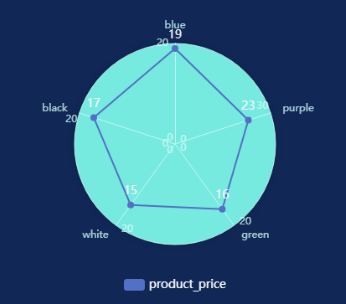
Radar Chart
A radar chart can display analyzed data or ratios, allowing you to easily view various data indicators and trends. It maps the data of multiple dimensions onto a coordinate axis that starts at the same center point and ends at the circumference, connecting the points of the same group with lines. This chart is often used to show the distribution of dimension values. This section will introduce the configuration of radar charts.
Fields
- In the Data area on the right, select a dataset, and double-click or drag required dimension and metric fields to the corresponding areas on the Fields tab.
Table 1 Parameters on the Fields tab Parameter
Description
Field display content
Click
 in the column and click Field display content to modify the field display content on the displayed page. Click OK.
Aggregation Mode
Select Aggregation Method and click to support setting of no aggregation, sum, count, distinct count, maximum value, minimum value, average value, population standard deviation, sample standard deviation, sample variance, range start value, and range end value.
Drilldown
You can enable drilldown for dimension fields. For example, you can view data at different levels of granularity, ranging from years down to quarters, months, weeks, days, hours, minutes, and even seconds, depending on the time dimension.- Click the field (
 ) in the column and drag the field of the target location to be drilled down to the Drilldown area.
 - Click Update to test whether the drilldown function is set successfully.
NOTE:
- Drill-down is only supported for dimension fields, not for metric fields.
- You can only select one field as the starting point for drill-down.
- When drilling down on time, the system will automatically add the subdivided time periods to the drill-down order list and include them in the sorting field (fields that are already in the sorting field will not be added again).
- Drill-down icons should be highlighted for fields that have already been drilled down. If you remove the drill-down field from the dimension, the entire drill-down function box will disappear.
- Click the field (
- Set the color legend: Drag the desired field into Color Legend (dimensions only) on the Field tab. After setting, the chart will use different colors to distinguish data based on dimensions.
- Set a filter.
- Find the data field you need in the dimension and metric lists within the data column.
- Click
 next to the field you wish to filter and you will be directed to the filter settings page.
 - Click OK.
Table 2 Filter parameters Type
Parameter
Description
string
Condition
Filter Mode: The options are Condition and Enumeration.
Condition Type: The options are And condition and Or condition.
Filter Condition: The options are Exact match, Contain, Start with, End with, Not match, Not contain, Null, and Not null.
Enumeration
Query Mode: The options are Single-select and multi-select.
Filter Condition: The options are >, ≥, <, ≤, =, ≠, Null, and Not null.
Metric
Condition Type
The options are And condition and Or condition.
Filter Condition
The options are >, ≥, <, ≤, =, ≠, Null, and Not null. You can select Before aggregation and After aggregation for data.
NOTE:If you select Before aggregation, data is filtered before aggregation. If you select After aggregation, data is filtered after aggregation. For aggregation concepts, see Creating a Dataset.
You can click Create Filter Condition to set multiple filter criteria.
Date
Range value
Select a time range for filtering.
Single value
Set a single time for filtering.
Condition
You can select And condition or Or condition as the condition type and select filter condition like >, ≥, <, ≤, and =.
You can click Create Filter Condition to set multiple filter criteria.
- Set sorting.
- Drag and drop required data fields from the Dimension and Metric (Indicator) areas under Data to the Sorting area.
- Click
 next to a field in the Sorting area and select a sorting mode. The sorting modes are Ascending, Descending, and Custom.
 - To cancel sorting, click
 next to the sorting field.
- Set the maximum number of query results.
Enter the maximum number of records that can be returned in the text box. The default value is 1000.
- Set automatic refresh.
The auto refresh interval supports the following options: no refresh, 1 minute, 5 minutes, 15 minutes, and 30 minutes.
Styles
|
Parameter |
Description |
|---|---|
|
W |
Width of the target, in pixels. |
|
H |
Height of the target, in pixels. |
|
X |
Position of the target on the canvas, in pixels. |
|
Y |
Position of the target on the canvas, in pixels. |
|
Opacity |
Adjust the transparency of the target on the canvas using a slider or by manually entering a percentage. A higher percentage means lower transparency. |
|
Parameter |
Description |
|---|---|
|
Font |
Font of the text in the chart. |
|
Parameter |
Description |
|---|---|
|
Show Shape Line |
Set whether to display the chart border, the type of border, and its weight. |
|
Shape Area Filling |
Height of the target, in pixels. |
|
Show Mark Point |
Set the type of marker points, supporting both round and square shapes. |
|
Null Value Processing |
Set the handling method for null values, supporting Delete, Intelligent delete, and Set to zero. |
|
Parameter |
Description |
|---|---|
|
Visual Style |
Set the visualization style, supporting Polygon and Circle. |
|
Radius Ratio |
Set the radius ratio. The input value must range from 0 to 100. |
|
Branch |
Set the font size, color, and font weight of the branch. |
|
Axis Split Number |
Set the number of segments on the coordinate axis. The input value must range from 0 to 10. |
|
Show Tick |
Set whether to display the scale line. |
|
Show Grid Line |
Set whether to display grid lines. Set the type, weight, and color of the grid lines. |
|
Show Axis Label |
Set whether to display axis labels. Set the font size, color, and font weight of the axis labels. |
|
Parameter |
Description |
|---|---|
|
Legend |
|
|
Show Label Attribute |
|
|
Parameter |
Description |
|---|---|
|
Show/Hide Tooltips |
|
|
Series |
|
Chart Display
Feedback
Was this page helpful?
Provide feedbackThank you very much for your feedback. We will continue working to improve the documentation.See the reply and handling status in My Cloud VOC.
For any further questions, feel free to contact us through the chatbot.
Chatbot


