
Overview
Cost Summary
The line chart displays current month costs in the following dimensions:
- Current month costs: original costs already generated for the current month
- Last month same-period costs: total original costs generated in the same period of the last month
- Forecasted month-end costs: total original costs that may be generated in the current month. Such costs are forecasted based on the costs for historical months, regardless of the impact of current month costs.
- Last month costs: original costs generated for the last month
Top 5 Costs By MoM Growth ($)
This area displays the top 5 costs by MoM growth ($). The data can be displayed by service type, enterprise project, cost tag, cost category, or linked account.
- MoM Growth ($): MoM growth = Month-to-date costs – Last month same-period costs
- MoM Growth (%): The MoM growth (%) is calculated as follows:

- Month-to-Date Cost: original costs generated from the beginning of the month to the current date of the month
- Last Month Same-Period Cost: original costs generated in the same period of the last month
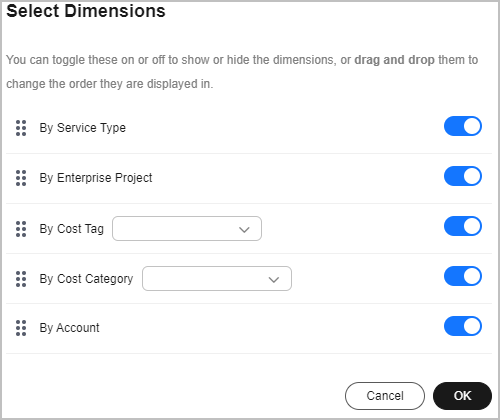
You can toggle the provided switches on or off to show or hide specified dimensions, and drag and drop them to change the order they are displayed in. In addition, you can give default values for cost tags and cost categories.
Latest News
This area displays the latest information about function releases and optimizations in Cost Center. You can click Learn More to view the list of all function updates in Cost Center.
Cost Optimization Recommendations
This area presents the cost-saving opportunities and estimated savings, which are calculated based on the usage of pay-per-use resources and savings plans.
Cost Anomalies (Last 30 Days)
This area displays the number of cost anomalies in the last 30 days. You can click Enable Alerting to specify the recipients who will receive alerts.
Budget Management
This area displays the top 3 percentages of actual cost divided by the budgeted amount.
Feedback
Was this page helpful?
Provide feedbackThank you very much for your feedback. We will continue working to improve the documentation.See the reply and handling status in My Cloud VOC.
For any further questions, feel free to contact us through the chatbot.
Chatbot


