Viewing Lite Cluster Monitoring Metrics Using Prometheus
Context
Prometheus is an open-source monitoring tool. ModelArts supports the Exporter function, enabling you to use third-party monitoring systems like Prometheus to obtain the metric data collected by ModelArts.
Description
- This function is a whitelist function. To use this function, submit a service ticket.
- After this function is enabled, third-party components compatible with the Prometheus metric format can obtain the metric data collected by ModelArts through API http://<node IP address>:<port number>/metrics.
- Before enabling the port, you need to confirm the port number. It can be any number within the range of 10120 to 10139. Ensure that the selected port number is not occupied by other applications on each node.
Interconnecting Prometheus with ModelArts in Kubernetes
- Use kubectl to connect to the target cluster. For details, see Connecting to a Cluster Using kubectl.
- Configure Kubernetes access authorization.
Use any text editor to create the prometheus-rbac-setup.yml file. The content of the YAML file is as follows:

This YAML file defines the role (ClusterRole) for Prometheus and assigns the necessary access permissions. Additionally, it creates the account (ServiceAccount) for Prometheus and binds this account to the role (ClusterRoleBinding).
apiVersion: rbac.authorization.k8s.io/v1
kind: ClusterRole
metadata:
  name: prometheus
rules:
- apiGroups: [""]
  resources:
  - pods
  verbs: ["get", "list", "watch"]
- nonResourceURLs: ["/metrics"]
  verbs: ["get"]
---
apiVersion: v1
kind: ServiceAccount
metadata:
  name: prometheus
  namespace: default
---
apiVersion: rbac.authorization.k8s.io/v1
kind: ClusterRoleBinding
metadata:
  name: prometheus
roleRef:
  apiGroup: rbac.authorization.k8s.io
  kind: ClusterRole
  name: prometheus
subjects:
- kind: ServiceAccount
  name: prometheus
  namespace: default
- Run the following commands to create RBAC resources:
$ kubectl create -f prometheus-rbac-setup.yml
clusterrole "prometheus" created
serviceaccount "prometheus" created
clusterrolebinding "prometheus" created
- Use any text editor to create the prometheus-config.yml file with the following content. This YAML file manages Prometheus configurations. When Prometheus is deployed, these configurations can be utilized by containers through file system mounting.
apiVersion: v1 kind: ConfigMap metadata: name: prometheus-config data: prometheus.yml: | global: scrape_interval: 10s scrape_configs: - job_name: 'modelarts' tls_config: ca_file: /var/run/secrets/kubernetes.io/serviceaccount/ca.crt bearer_token_file: /var/run/secrets/kubernetes.io/serviceaccount/token kubernetes_sd_configs: - role: pod relabel_configs: - source_labels: [__meta_kubernetes_pod_name] # Specifies that metric data is collected from the pod whose name starts with maos-node-agent-. action: keep regex: ^maos-node-agent-.+ - source_labels: [__address__] # Specifies the IP address and port number for obtaining metric data. __address__:9390 specifies the IP address of the POD, which is also the node IP address. action: replace regex: '(.*)' target_label: __address__ replacement: "${1}:10120" - Run the following command to create ConfigMap resources:
$ kubectl create -f prometheus-config.yml
configmap "prometheus-config" created
- Use any text editor to create the prometheus-deployment.yml file. The content is as follows:

This YAML file is used to deploy Prometheus. It grants the permissions of the created account (ServiceAccount) to Prometheus and mounts the created ConfigMap resource to the /etc/prometheus directory of the Prometheus container as a file system. The --config.file=/etc/prometheus/prometheus.yml parameter specifies the configuration file used by /bin/prometheus.
apiVersion: v1 kind: "Service" metadata: name: prometheus labels: name: prometheus spec: ports: - name: prometheus protocol: TCP port: 9090 targetPort: 9090 selector: app: prometheus type: NodePort --- apiVersion: extensions/v1beta1 kind: Deployment metadata: labels: name: prometheus name: prometheus spec: replicas: 1 template: metadata: labels: app: prometheus spec: hostNetwork: true serviceAccountName: prometheus serviceAccount: prometheus containers: - name: prometheus image: prom/prometheus:latest imagePullPolicy: IfNotPresent command: - "/bin/prometheus" args: - "--config.file=/etc/prometheus/prometheus.yml" ports: - containerPort: 9090 protocol: TCP volumeMounts: - mountPath: "/etc/prometheus" name: prometheus-config volumes: - name: prometheus-config configMap: name: prometheus-config - Run the following command to create a Prometheus instance and check the creation result:
$ kubectl create -f prometheus-deployment.yml
service "prometheus" created
deployment "prometheus" created

$ kubectl get pods
NAME                               READY     STATUS        RESTARTS   AGE
prometheus-55f655696d-wjqcl        1/1       Running       0          5s

$ kubectl get svc
NAME            TYPE        CLUSTER-IP       EXTERNAL-IP   PORT(S)          AGE
kubernetes      ClusterIP   10.96.0.1        <none>        443/TCP          131d
prometheus      NodePort    10.101.255.236   <none>        9090:32584/TCP   42s
Viewing Metric Data Collected by Prometheus
- On the CCE console, bind an EIP to the node where Prometheus is deployed. Enable the security group configuration for the node and add an inbound rule to allow external access to port 9090.

If you use Grafana to interconnect with Prometheus for report creation, you can deploy Grafana within the cluster. In this scenario, there is no need to bind a public IP address to Prometheus or configure a security group for it. Instead, you only need to bind a public IP address to Grafana and configure its security group.
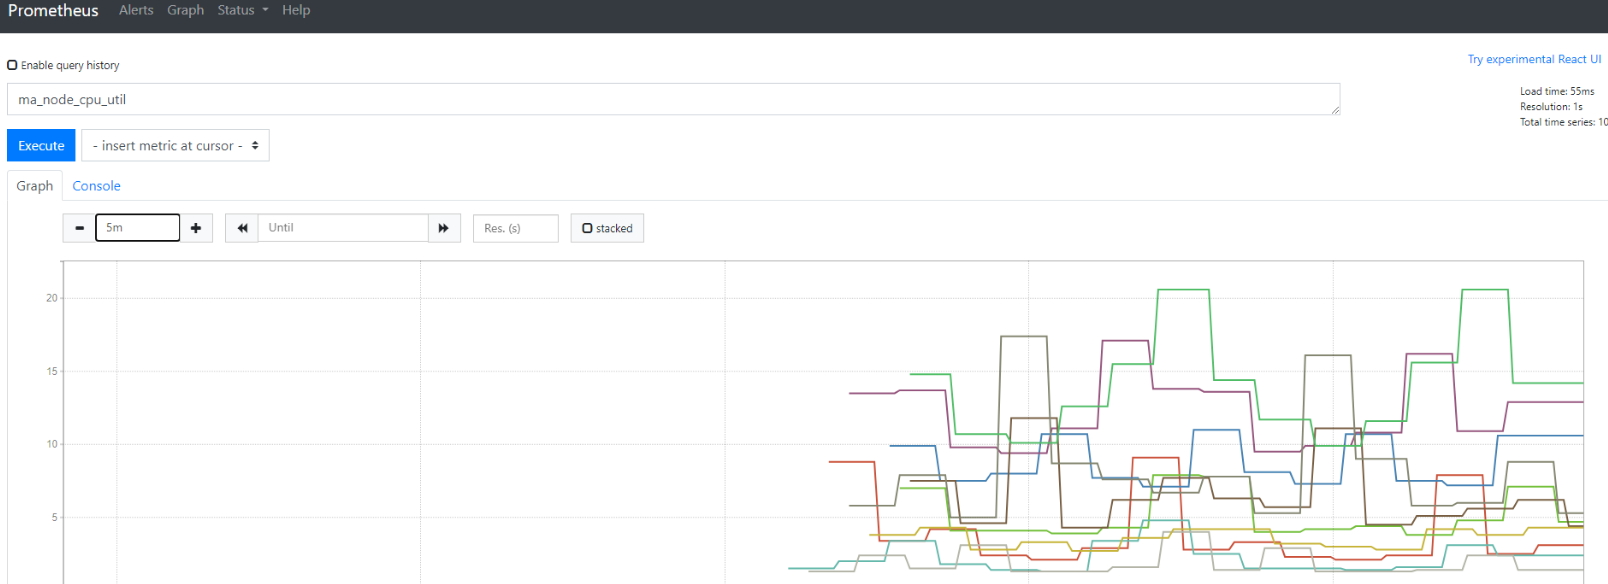
- Enter http://<EIP>:9090 in the address box of the browser. The Prometheus monitoring page is displayed. Click Graph and enter a metric name in the text box to view the metric data collected by Prometheus.
Figure 1 Example

Feedback
Was this page helpful?
Provide feedbackThank you very much for your feedback. We will continue working to improve the documentation.See the reply and handling status in My Cloud VOC.
For any further questions, feel free to contact us through the chatbot.
Chatbot


