Viewing Basic Monitoring Metrics
Basic monitoring is only available for ECSs, and monitoring data is reported by ECSs. You can view this data and set alarm rules for basic monitoring metrics without the need to install the Agent. If a metric meets the alarm condition, you will receive an alarm notification. For details about the metrics supported by basic monitoring, see Basic ECS Metrics.
Viewing Basic Monitoring Metrics
- Log in to the Cloud Eye console.
- In the navigation pane, choose Server Monitoring > Elastic Cloud Server.
- Locate the target ECS instance and click View Metric in the Operation column.
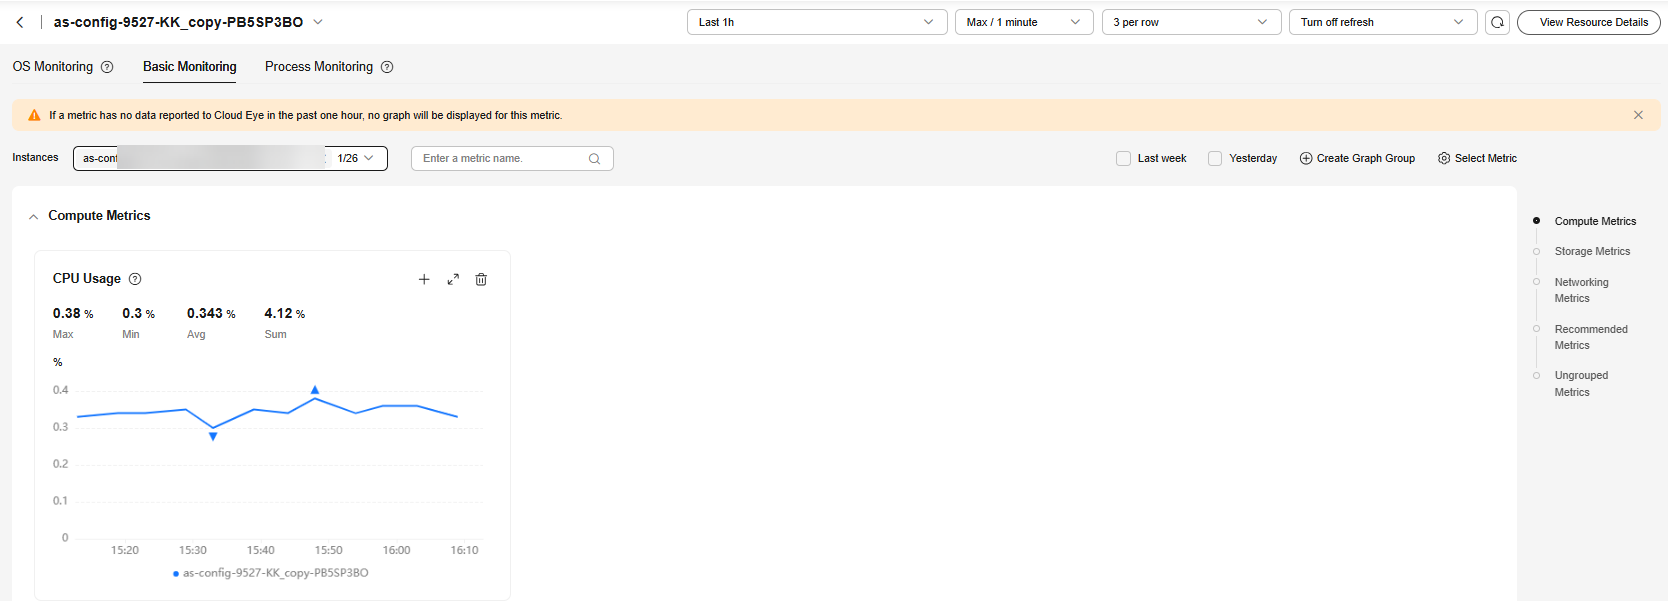
- Click the Basic Monitoring tab to view the graphs of the instance. For details, see Figure 1.
- On a graph, the time granularity varies with the monitoring period and aggregation type. For details, see Aggregation Types and Time Granularities for Different Monitoring Periods.
For details about the aggregation methods supported by Cloud Eye, see What Aggregation Methods Does Cloud Eye Support?
You can enable auto refresh and set the refresh interval to 10 seconds, 1 minute, 5 minutes, or 20 minutes.
- Hover your mouse over a graph. In the upper right corner, click
 to enlarge the graph for detailed data.
In the upper right corner, select a monitoring period (Last 15 min, Last 30 min, Last 1h, Last 2h, Last 3h, Last 12h, Last 1d, Last 7d, or Last 30d), or select Select Range to customize one, to view historical monitoring data from the last 155 days.
- In the upper right corner of the graph, click
 to create an alarm rule for the metric. For parameter details, see Creating an Alarm Rule and Notifications.
Feedback
Was this page helpful?
Provide feedbackThank you very much for your feedback. We will continue working to improve the documentation.See the reply and handling status in My Cloud VOC.
For any further questions, feel free to contact us through the chatbot.
Chatbot


