
Optimizing Hive
Overview
Hive architecture
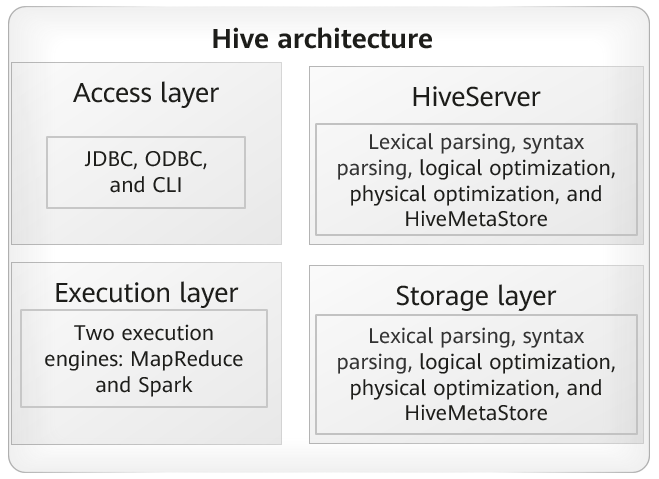
Hive provides the SQL capability of Hadoop. Hive SQL (HQL) was developed based on the standard SQL and is more suitable for the Hadoop distributed system. It is a de facto standard of the Hadoop system.
Hive tuning
After a user enters an HQL, Hive analyzes morphology and syntax of HQL, generates and optimizes an execution plan, and submits a task to YARN. Hive tuning covers the following parts:
- Access layer: user connection performance, such as the network speed, authentication, and the number of concurrent connections
- HiveServer: The execution plan is the main method of SQL optimization. You can view how Hive decomposes and orchestrates SQL statements through interfaces and optimize tasks based on the MapReduce or Spark execution status.
- HiveMetaStore: The MetaStore of Hive may be an independent external database. It affects the performance of HiveServer, mainly including the HiveMetaStore access time, access times, and number of concurrent connections.
- MapReduce/Spark: The execution status of MapReduce or Spark directly affects the Hive performance, such as the size of each task, how evenly tasks and resources are allocated, and how properly tasks are split.
- HDFS: I/O read at the base layer is a key factor to affect performance. Read and write performance as well as block size should be considered.
For details about MapReduce, Spark, and HDFS performance tuning, see their own performance tuning guides and documentation. This section mainly describes performance tuning for the first three aspects and also MapReduce and Spark.
Batch processing
Batch processing takes a long time and consumes a large number of resources. It can be tuned as follows:
- Use ORC files and appropriate compression algorithms, such as Zlib and Snappy. Zlib delivers a higher compression ratio but takes a longer time and consumes more resources than Snappy. Snappy balances the compression ratio and decompression performance. Snappy is recommended.
- Use Map Join to reduce Shuffle times, remarkably improving performance.
- If different SQL statements are used to provide the same function, the fewer MapReduce tasks are generated, the better.
- The default Hive configurations are typical. You can adjust some parameters to meet service requirements, for example, the file block size, the number of Map and Reduce tasks, and compression algorithm.
- Use partitions properly. Avoid too many partitions. Specify a specific partition in the query SQL statement.
Measurement metrics
Measurement metrics help you quickly detect Hive execution problems and locate Hive performance problems. Check the following metrics in sequence: common metrics, access layer metrics, HiveMetaStore metrics, HiveServer metrics, and metrics of other components such as MapReduce, Spark, and HDFS. The following are available metrics:
- Common metrics
Common performance metrics of servers: CPU usage, memory usage, disk I/O read and write speed, the number of used Cores. These metrics help you measure task execution status on the servers and check whether cluster loads are balanced.
- Access layer metrics
Number of Hive connections, number of concurrent SQL statements, input cache value (or batch size), and maximum number of requests that can be concurrency handled by a HiveServer instance (The default value is 500, and the value is restricted by JVM memory and CPU processing capability.)
- HiveMetaStore
Number of HiveMetaStore connections, number of concurrent SQL statements, and statement execution plan
- HiveServer
You can view the execution plans of SQL statements, tune SQL statements, and set the parameters of the MapReduce or Spark engine, such as the number of jobs, number of Map tasks, and number of Reduce tasks.
- Common test standards
TPC-DS is used to compare the performance of Hive with that of peering products or its earlier versions. Standard tests only provide reference for performance tests.
Metrics monitoring
- Common metrics
On the Hosts page of Manager, check host resource usage, for example, CPUs, memory, and I/O usage in the clusters.
- Access layer metrics
On the Hive service status page of Manager, check the number of HiveServer connections and the number of HQL statements successfully executed.
- HiveMetaStore metrics
On the Hive service status page of Manager, check the number of HiveMetaStore request connections and performance of key APIs.
- HiveServer-related metrics
Feedback
Was this page helpful?
Provide feedbackThank you very much for your feedback. We will continue working to improve the documentation.See the reply and handling status in My Cloud VOC.
For any further questions, feel free to contact us through the chatbot.
Chatbot


