
Optimizing Kafka Performance
Kafka performance optimization
Client configuration optimization
Producer configuration suggestions
For details, see Setting Parameters for Kafka Clients.
Consumer configuration suggestions
|
Parameter |
Recommended Value |
Description |
|
max.poll.records |
500 |
The maximum number of messages a consumer can consume at a time. The default value is 500. If consumption per message takes longer, use a smaller value and ensure that messages in a batch can be processed as max.poll.interval.ms specified. |
|
max.poll.interval.ms |
300000 |
The maximum interval between two consumption pulls. The default interval is 300s. If the interval exceeds 300s, the consumer is considered abnormal. |
|
fetch.min.bytes |
Adjusted based on services |
The minimum size of data each fetch request returns. The default value is 1. The bigger the value, the higher the throughput and latency. |
Performance metrics
Kafka provides the following performance metrics to help analyze message accumulation, partition data skew, and traffic imbalance.
|
Metric ID |
Metric Name |
Description |
|
broker_disk_usage |
Disk Capacity Usage |
Disk usage of the Kafka VM |
|
broker_cpu_core_load |
Average Load per CPU Core |
Average load of each CPU core of the Kafka VM |
|
broker_memory_usage |
Memory Usage |
Memory usage of the Kafka VM |
|
broker_cpu_usage |
CPU Usage |
CPU usage of the Kafka VM |
|
group_msgs |
Accumulated Messages |
Total number of accumulated messages in all consumer groups of a Kafka instance |
|
topic_messages_remained |
Available Messages |
Number of remaining messages that can be retrieved from the specified topic in the consumer group |
|
broker_messages_in_rate |
Message Creation Rate |
Kafka node production speed per second |
|
broker_connections |
Connections |
Number of connections on the Kafka node |
Data partition optimization
Kafka divides each topic into multiple partitions for distributed message storage. Each partition has one or more replicas distributed on different brokers. Each replica stores a copy of full data. Messages are synchronized among replicas. The following figure shows the relationships between topics, partitions, replicas, and brokers.
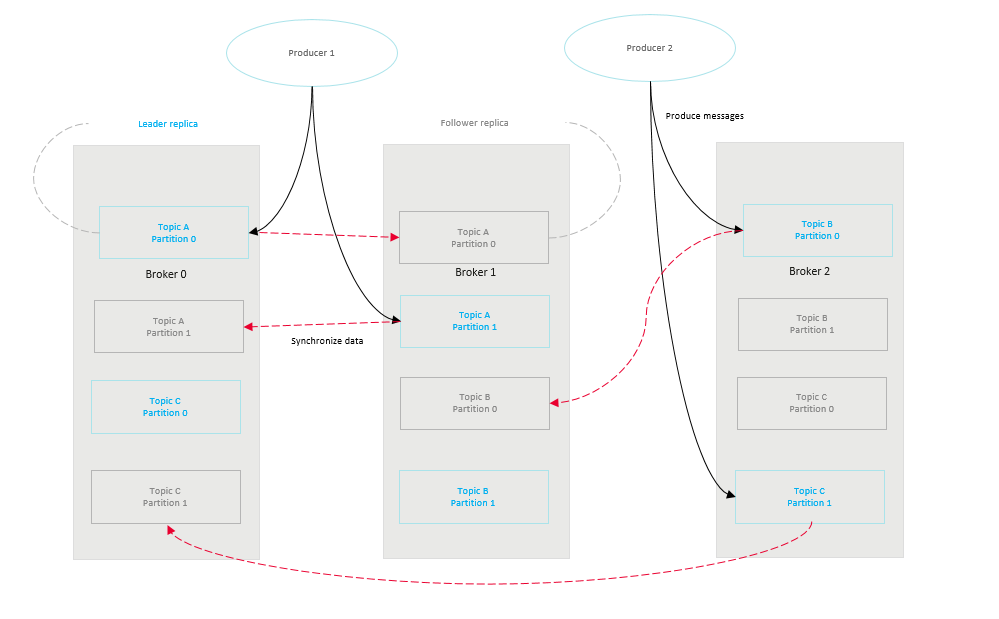
Uneven service data among brokers and partitions may happen, leading to low performance of Kafka clusters and low resource utilization.
Causes of uneven service data:
- The traffic of some topics is much heavier than that of others.
- Producers specified partitions when sending messages, leaving unspecified partitions empty.
- Producers specified message keys to send messages to specific partitions.
- The system re-implements flawed partition allocation policies.
- There are new Kafka brokers with no partitions allocated.
- Cluster changes lead to switches and migration of leader replicas, causing data on some brokers to increase.
Data compression
If CPU resources are sufficient, compress the data with compression algorithms.
Common compression algorithms include ZIP, gzip, Sappy, and LZ4. You need to consider the data compression rate and duration when selecting compression algorithms. Generally, an algorithm with a higher compression rate consumes more time.
|
Compression Mode |
Compression Ratio |
Client CPU Usage |
Server CPU Usage |
Disk Usage |
Broker Bandwidth Usage |
|
gzip |
Medium |
Medium |
Low |
Medium |
Low |
|
LZ4 |
Medium |
Medium |
Medium |
Medium |
Medium |
|
zstd |
High |
Medium |
Low |
Low |
Low |
|
Snappy |
Low |
High |
High |
High |
High |
For high TPS, use LZ4; for lower network I/O or CPU usage, use zstd. gzip is not recommended because it is a computing-sensitive compression algorithm. Batch message compression can be better used to obtain higher TPS.
Feedback
Was this page helpful?
Provide feedbackThank you very much for your feedback. We will continue working to improve the documentation.See the reply and handling status in My Cloud VOC.
For any further questions, feel free to contact us through the chatbot.
Chatbot


