Performance Analysis
Profiler automatically obtains the CPU usage, memory usage, and latency during application running, and displays the calling relationship and execution efficiency of each method, class, thread, and package in real time through flame graphs, helping you optimize code.
Procedure
- Log in to the APM console.
- Click
 on the left and choose Application > Application Performance Management.
 - In the navigation pane, choose Application Monitoring > Metrics.
- In the tree on the left, click
 next to the target environment.
 - Click the Profiler Performance Analysis tab.
- Click Performance Analysis.
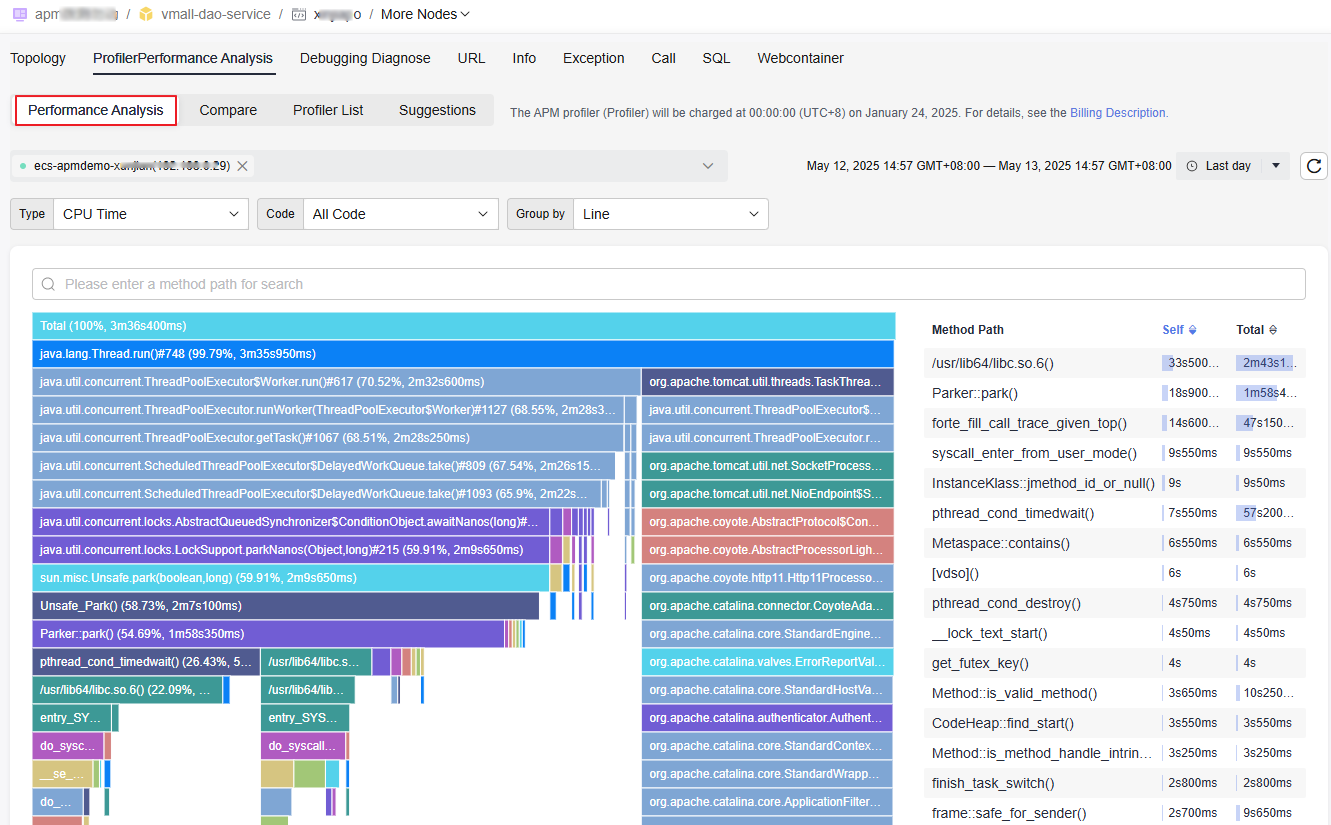
- On the displayed page, select an instance, performance analysis type, code, and aggregation dimension.
Figure 1 Performance analysis

- Instance: Select up to two instances from the drop-down list.
- Type: Select a type from the drop-down list. Options: CPU Time, Allocated Memory, Latency, and Live Object Memory.
- Code: Select a range from the drop-down list. Options: My Code and All Code.
- Group By: Select an aggregation dimension from the drop-down list. Options: Line, Method, Class, and Package.
Table 1 Performance analysis parameters Item
Parameter
Description
Type
CPU Time
CPU time for each method.
Allocated Memory
Allocated heap memory (including both reclaimed and unreclaimed memory). It can be used in the frequent GC scenario.
Live Object Memory
Heap memory that has been allocated but has not been reclaimed. It is used in the memory leakage scenario. This feature requires the JDK version to be 17.
Latency
Total time consumed for executing the methods of trace-related threads. It includes the CPU time and I/O wait time.
Code
My Code
User code.
All Code
All code.
Group By
Line
Code line.
Method
Method.
Class
Class.
Package
Java package name.
- Search by method path: Set search criteria in the search box and click
 to view the flame graph that meets the search criteria.
 - Select a time range. Default: Last 20 minutes.
Options: Last 5 minutes, Last 20 minutes, Last hour, Last 3 hours, Last 6 hours, Last day, Today, Yesterday, or Custom.
- The calling relationships and execution efficiency of each thread, method, class, and package are displayed in real time in the lower part of the page.
Table 2 Profiler parameters Parameter
Description
Flame Graph
- The Y axis (vertical axis) of the flame graph indicates the call stack. Each layer is a function (package). The deeper a call, the higher a flame layer. The bottom (flame end) is the function that is being executed, and the top is the parent function.
- The X axis (horizontal axis) of the flame graph indicates the CPU time, total time for executing trace-related thread methods, allocated heap memory, or heap memory that has been allocated but has not been reclaimed. Take the CPU time as an example. The longer the CPU time, the longer the distance on the X axis of the flame graph.
- In the flame graph, the same methods or packages have the same color.
- Move the cursor to the flame graph to check the details about a method, class, or thread.
- Click a method bar in the flame graph. It is zoomed in horizontally. To restore the flame graph, click Total in the first column.
Method Path
- Move the cursor to a method of the Location class. The detailed information about the method is displayed.
- Click a method of the Location class. This method is highlighted on the flame graph, and other methods are grayed. To restore the flame graph, click the same method again.
Self
Performance consumption of the method itself only. The value is the sum of the execution results of all threads and may be greater than the selected time range.
Total
Total performance consumption of both the method itself and called methods. The value is the sum of the execution results of all threads and may be greater than the selected time range.
Feedback
Was this page helpful?
Provide feedbackThank you very much for your feedback. We will continue working to improve the documentation.See the reply and handling status in My Cloud VOC.
For any further questions, feel free to contact us through the chatbot.
Chatbot


