Snapshots
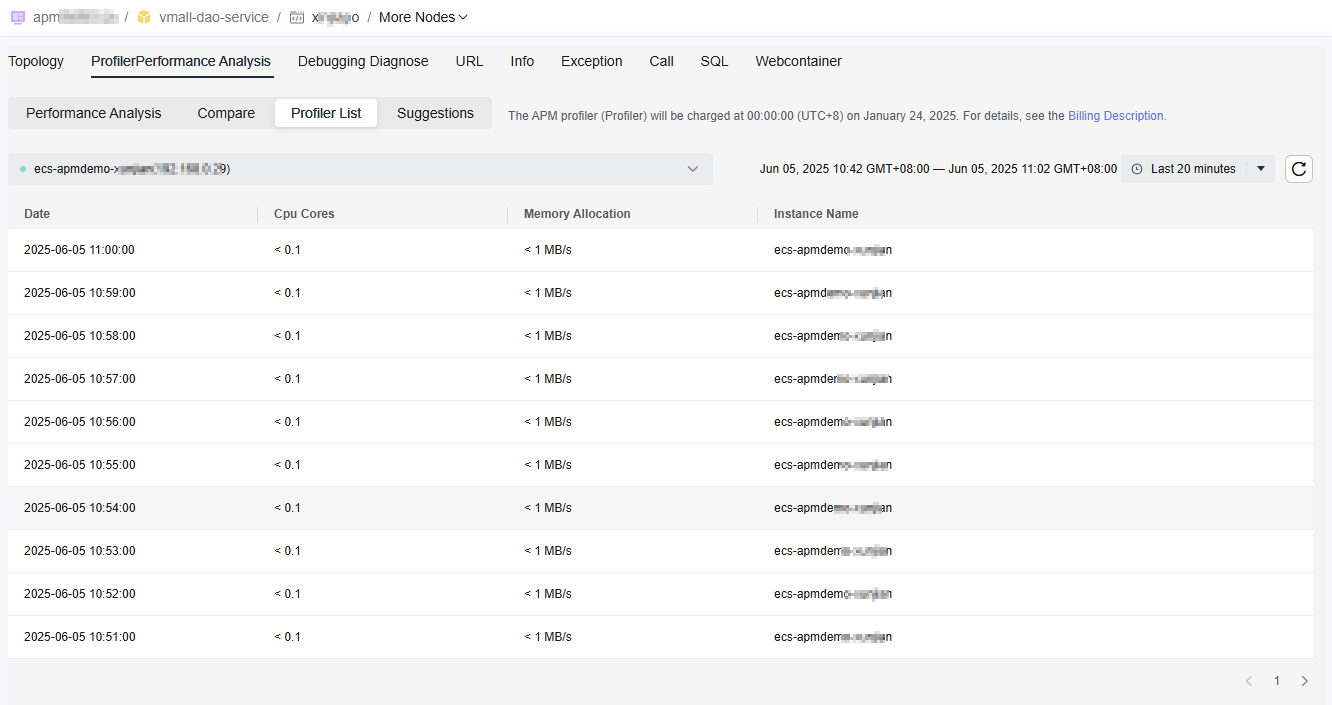
APM Profiler supports snapshot query. The snapshot list allows you to obtain the application debugging information by minute, including the time, number of CPU cores, memory allocation rate, and instance name.
Procedure
- Log in to the APM console.
- Click
 on the left and choose Application > Application Performance Management.
 - In the navigation pane, choose Application Monitoring > Metrics.
- In the tree on the left, click
 next to the target environment.
 - Click the Profiler Performance Analysis tab.
- Go to the snapshot page.
- On the displayed page, select the target instance to check data.
Figure 1 Snapshots

Instance: Select up to one instance from the drop-down list.
Table 1 Snapshot parameters Parameter
Description
Date
Time when the debugging information is obtained
CPU Cores
Number of CPU cores
Memory Allocation
The amount of memory allocated per time unit
Instance
Instance name
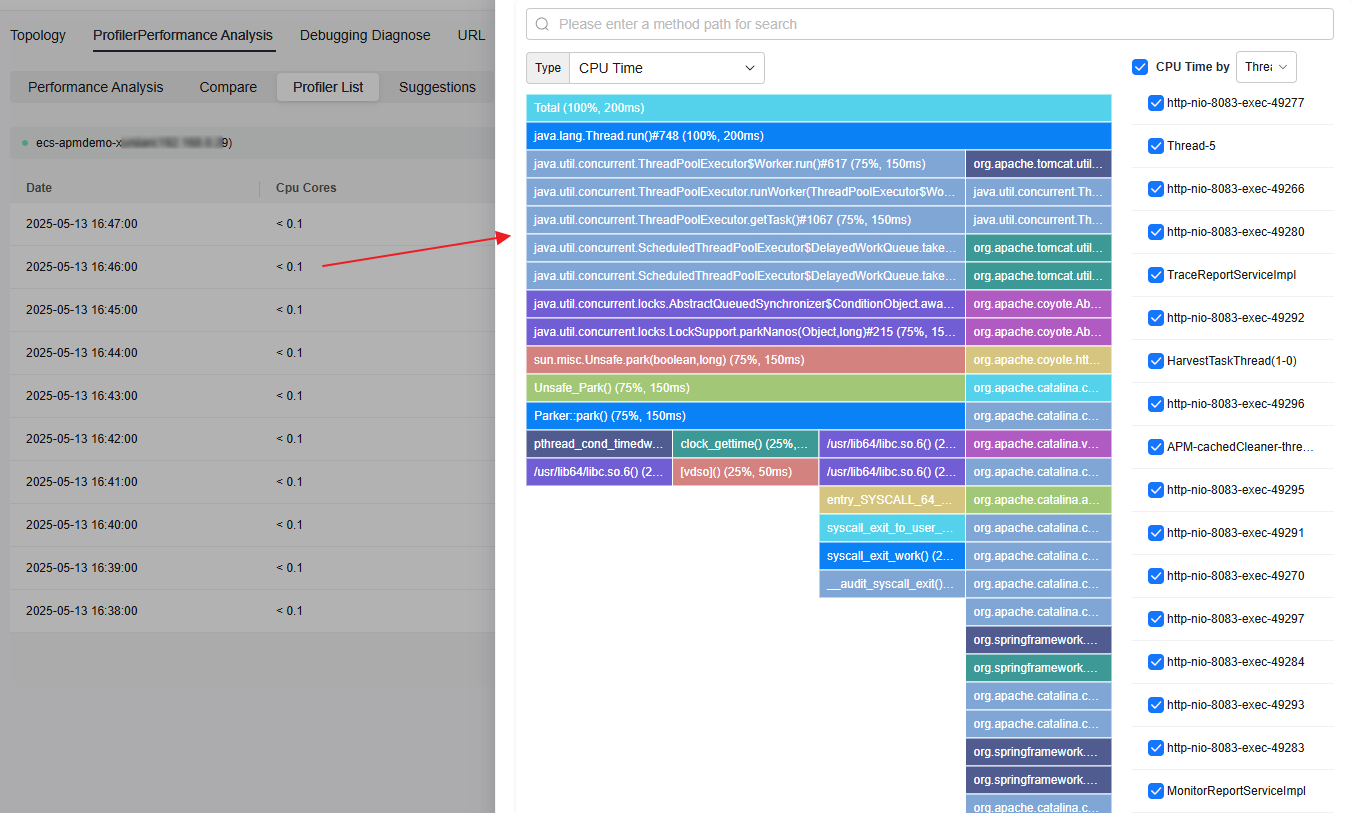
- Locate a row in the list and click it. The corresponding flame graph is displayed.
Figure 2 Snapshot flame graph

Search by method name: Set search criteria in the search box and click
 to view the flame graph that meets the search criteria.
Type: Select a type from the drop-down list. Options: CPU Time, Allocated Memory, Latency, and Live Object Memory.
CPU Time by: Select a value from the drop-down list. Options: Line, Method, Class, Package, Thread, and API. You can select one or more options.
Table 2 Flame graph description Parameter
Description
Flame Graph
- The Y axis (vertical axis) of the flame graph indicates the call stack. Each layer is a function (package). The deeper a call, the higher a flame layer. The bottom (flame end) is the function that is being executed, and the top is the parent function.
- The X axis (horizontal axis) of the flame graph indicates the CPU time, total time for executing trace-related thread methods, allocated heap memory, or heap memory that has been allocated but has not been reclaimed. Take the CPU time as an example. The longer the CPU time, the longer the distance on the X axis of the flame graph.
- In the flame graph, the same methods or packages have the same color.
- Move the cursor to the flame graph to check the details about a method, class, or thread.
- Click a method bar in the flame graph. It is zoomed in horizontally. To restore the flame graph, click Total in the first column.
Feedback
Was this page helpful?
Provide feedbackThank you very much for your feedback. We will continue working to improve the documentation.See the reply and handling status in My Cloud VOC.
For any further questions, feel free to contact us through the chatbot.
Chatbot


