Custom Statistics
APM app monitoring supports custom statistics reporting.
Checking Custom Statistics List
- Log in to the APM console.
- Click
 on the left and choose Management & Governance > Application Performance Management.
 - In the navigation pane on the left, choose App Monitoring > Custom Statistics. Then select an application from the application drop-down list. The custom statistics of the application are displayed. By default, custom statistics are sorted by Last Reported in descending order.
- Custom statistics parameters include Event Name, Trigger Times, Devices, and Last Reported.
Table 1 Custom statistics parameters Parameter
Description
Event Name
Name of an event.
Trigger Times
Number of times that an event is triggered.
Devices
Number of devices that trigger the event.
Last Reported
Time when the last event was reported.
- In the upper right corner of the Custom Statistics page, select a time range. Default: Last 20 minutes.
Options: Last 20 minutes, Last hour, Last 3 hours, Last 6 hours, Last day, Today, Yesterday, Last week, Last month, or Custom.
- In the search box, enter an event name and click
 . The custom statistics that meet the search criterion are displayed.
 - Click Tracking Examples. Event and time statistics tracking examples are displayed.
- The format for Android or HarmonyOS tracking is "APMSDK(key, value)". value can be of the string or numeric type.
- The format for iOS tracking is "[APMSDK(key, value)]". value can be of the string or numeric type.
- If value is of the string type, the content of value will be displayed when custom statistics are queried.
If value is of the numeric type, -- will be displayed when custom statistics are queried.
- Custom statistics parameters include Event Name, Trigger Times, Devices, and Last Reported.
Checking Custom Statistics
- In the navigation pane on the left, choose App Monitoring > Custom Statistics. Then select an application from the application drop-down list. The custom statistics of the application are displayed.
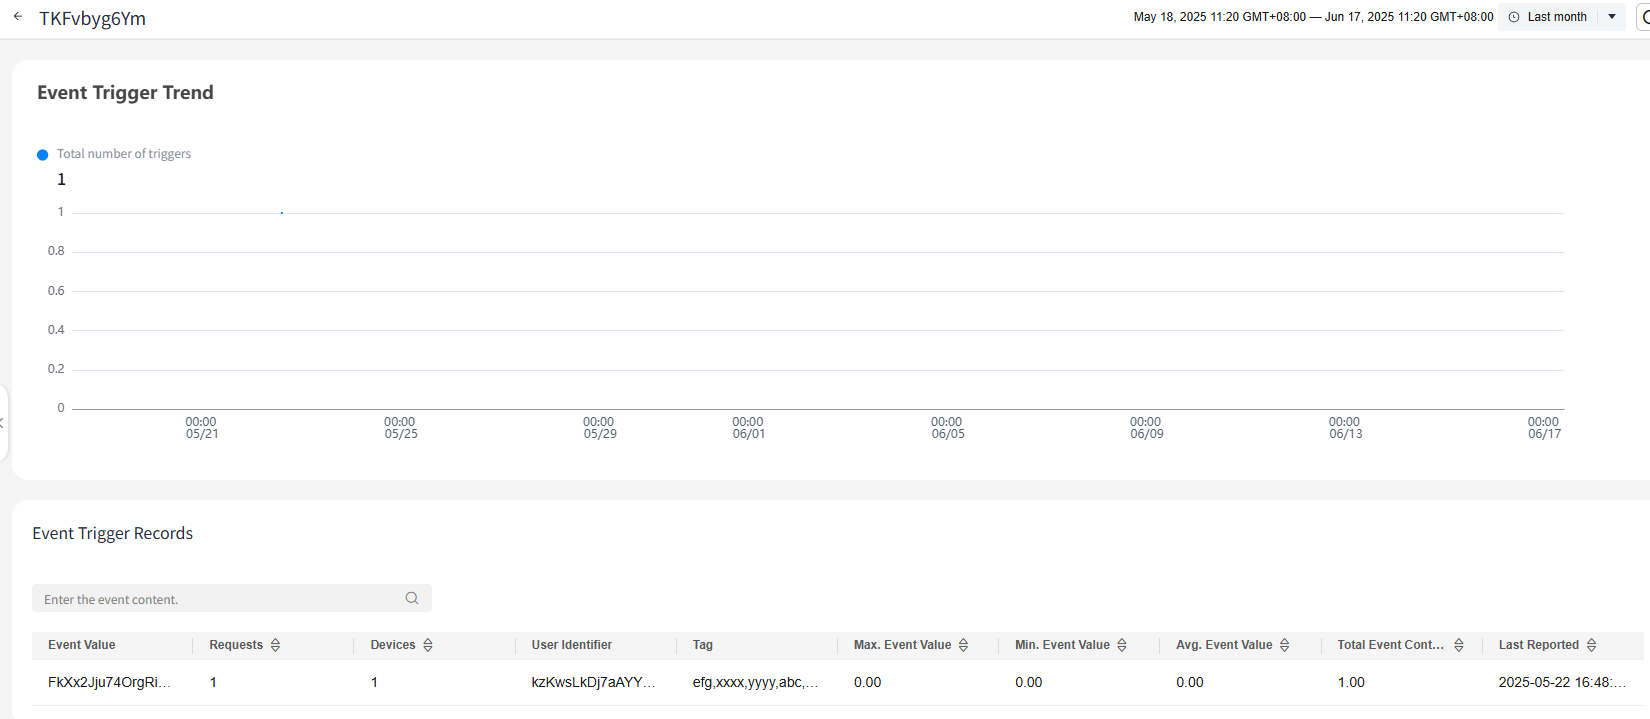
- Click an event name in the Event Name column. Event Trigger Trend and Event Trigger Records are displayed.
- Event Trigger Trend: displays the total number of times that an event is triggered. Move the cursor to the event trigger trend graph. The event trigger details are displayed.
- Event Trigger Records: displays the event content, number of requests, number of devices, user identifier, tag, maximum event value, minimum event value, average event value, event value sum, and last report time.
- By default, event trigger records are sorted by Last Reported in descending order.
Figure 1 Event details
- Click
 next to an event name in the Event Name column. Event Value, Trigger Times, Devices, and Last Reported are displayed.
 - Click an event value in the Event Name column. Event Trigger Trend and Event Trigger Records are displayed.
- Event Trigger Trend: displays the total number of times that an event is triggered. Move the cursor to the event trigger trend graph. The event trigger details are displayed.
- Event Trigger Records: displays the event value, user identifier, tag, and last report time.
Table 2 Custom statistics parameters Parameter
Description
Event Value
Event value. For details, see Custom Statistics.
Requests
Number of requests.
Devices
Number of devices.
User Identifier
User identifier.
Tag
Event tag.
Max. Event Value
Maximum event value.
Min. Event Value
Minimum event value.
Avg. Event Value
Average event value.
Event Value Sum
Sum of event values.
Last Reported
Time when the last custom event was reported.
Feedback
Was this page helpful?
Provide feedbackThank you very much for your feedback. We will continue working to improve the documentation.See the reply and handling status in My Cloud VOC.
For any further questions, feel free to contact us through the chatbot.
Chatbot


