Topology
The topology displays the call relationships between services within a period. The statistics can be collected from the caller or the callee. You can also view the trend. On the topology, you can view the call relationships between services and check whether the calls between services are normal to quickly locate faults. The application relationships, call data (service and instance metrics), and health status are clearly displayed.
Viewing the Topology
- Log in to the APM console.
- Click
 on the left and choose Application > Application Performance Management.
 - In the navigation pane, choose Application Monitoring > Metrics.
- In the tree on the left, click
 next to the target environment.
 - Switch to the Topology tab page. The call trend of the selected instance is displayed.
Figure 1 Viewing the topology

- Click a line in the diagram. The relationships between components or between components and instances are displayed.
Figure 2 Relationships between instances

- The diagram includes the number of requests, average RT, error rate, and corresponding line graphs.
- Click the drop-down list in the upper left corner of the line graph and select an instance.
- Click
 in the upper right corner of the line graph. All instance views corresponding to a parameter are displayed.
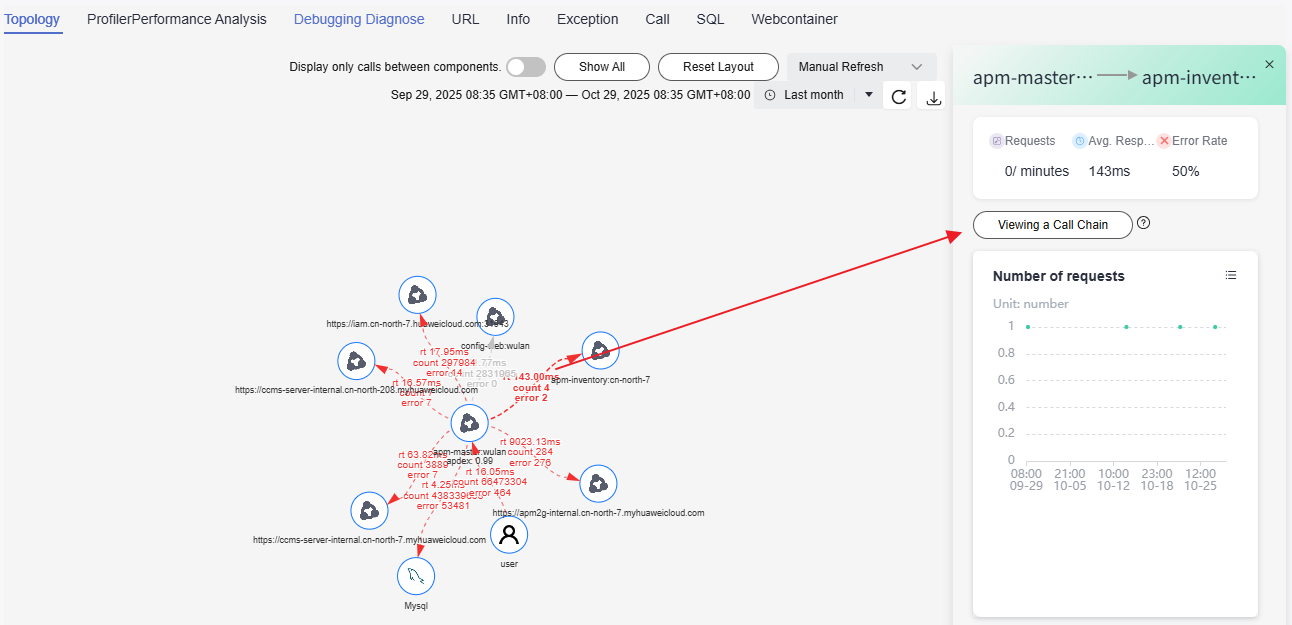
- The diagram shows the call relationships between components and enables you to check the traces between components.
Figure 3 Checking the traces between components

- Redirection upon trace query is supported only by Agent 2.5.3 or later.
- Click Viewing a Call Chain. The trace page is displayed, showing the trace information between components. On the trace page, the value of Custom Parameter is the value of lubanops-nenv-id by default. For example, lubanops-nenv-id=13.
- The diagram includes the number of requests, average RT, error rate, and corresponding line graphs.
- Right-click a component and then click Viewing a Call Chain or Viewing Indicators.
Figure 4 Viewing the call chain or indicators of the component

- Click
 next to Display only calls between components.
When the button turns blue, only the calls between components are displayed.
- Click Show All to display all call relationships of the selected instance in a specified time range.
- Click Reset Layout to restore to the initial topology.
- Select the refresh mode and time. Default: Manual Refresh. In addition, Automatic refresh in 1 minute, Automatic refresh in 5 minutes, and Automatic refresh in 15 minutes are supported.
- Select a time range. Default: Last 20 minutes.
Options: Last 20 minutes, Last hour, Last 3 hours, Last 6 hours, Last day, Today, Yesterday, Last week, Last month, or Custom.
- Click
 to refresh the topology.
 - Click
 to download the current topology to the default path.
- Click
Feedback
Was this page helpful?
Provide feedbackThank you very much for your feedback. We will continue working to improve the documentation.See the reply and handling status in My Cloud VOC.
For any further questions, feel free to contact us through the chatbot.
Chatbot


