
Ingesting Other Middleware Metrics to AOM
If existing middleware Exporters do not meet your requirements, install your own Exporter and create a collection task to monitor middleware metrics.
Prerequisites
Procedure
- Log in to the AOM 2.0 console.
- In the navigation pane on the left, select either of the following methods to ingest middleware metrics:
- Method 1: Choose Access > Access Center. On the displayed page, click the Other components card in the Prometheus Middleware panel. (The new access center does not support the connection of other components. Click Back to Old Version in the upper right corner to switch from the new access center to the old one.)
- Method 2: Choose Prometheus Monitoring > Instances. Click a Prometheus instance for ECS. On the instance details page, choose Access Center and then click the Other components card.
- On the displayed page, set parameters by referring to the following table.
Figure 1 Configuring a collection task
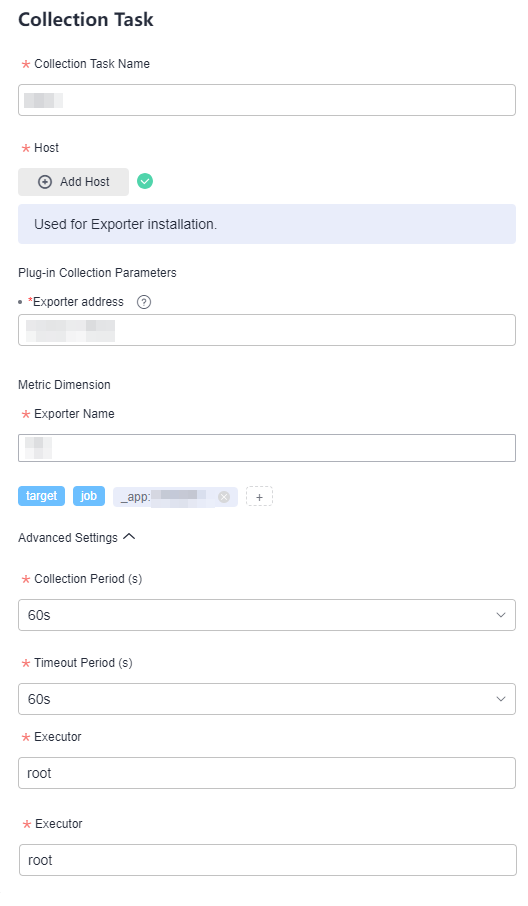
Table 1 Parameters for configuring a collection task Operation
Parameter
Description
Select Instance
Prometheus Instance
Select a Prometheus instance for ECS to store collected data.
A collection task is associated with the Prometheus instance to mark and classify collected data. If no Prometheus instance is available, create one.
Set Plug-in
OS
Operating system of the host. Only Linux is supported.
Collection Plug-in
The default value is CUSTOM_EXPORTER.
Plug-in Version
Select a plug-in version. Plug-in versions that have not been released are dimmed and cannot be selected.
Set Collection Task
Collection Task Name
Name of a collection task. Enter 1 to 50 characters starting with a letter. Only letters, digits, underscores (_), and hyphens (-) are allowed.
Host
Click Add Host. On the Add Host page, select the host for configuring the collection task and installing Exporter.
- Search for and select a host by the host name, IP address, or Agent status.
- You can click
 in the upper right corner to deselect the selected host.
 - Ensure that the UniAgent of the selected host is running. Otherwise, no data can be collected.
Plug-in Collection Parameters
Exporter Address: IP address and port number of the host where Exporter is installed. The format is "IP address:Port", for example, 10.0.0.1:9100
Metric Dimension
Exporter Name: Enter an Exporter name.
Click . In the displayed dialog box, select Built-in or Custom to add a metric dimension.
- Metric dimension name:
- Built-in metric dimensions: _app, _comp, and _env are available, which are used to identify applications, components, and environments, respectively.
- Custom metric dimension: Enter a metric dimension name. Each name can contain 1 to 64 characters. Only letters, digits, and underscores (_) are allowed. Each name must start with a letter or underscore.
For a host, each metric dimension name must be unique.
- Metric dimension value: Enter the value of a metric dimension. This value can be duplicate but cannot be empty. Each value can contain 1 to 128 characters. The following characters are not allowed: &|><$;'!-()
Up to 10 dimensions can be added. For example, if the dimension name is label1 and the dimension value is label2, label1:"label2" will be displayed.
Advanced Settings
Configure the following parameters:
- Collection Period (s): O&M data collection period, in seconds. Options: 10s, 30s, and 60s (default).
- Timeout Period (s): the maximum time allowed for executing a collection task, in seconds. Options: 10s, 30s, and 60s (default). The timeout period cannot exceed the collection period.
- Executor: user who executes the collection task, that is, the user of the selected host. The default value is root. Currently, only the root user is supported.
- Click Create.
- The connected plug-in will be displayed on the collection task page. Click the name of a collection task. On the displayed page, you can check the configuration of the collection task.
Feedback
Was this page helpful?
Provide feedbackThank you very much for your feedback. We will continue working to improve the documentation.See the reply and handling status in My Cloud VOC.
For any further questions, feel free to contact us through the chatbot.
Chatbot


