- What's New
- Function Overview
- Service Overview (2.0)
- Billing (2.0)
- Getting Started (2.0)
-
User Guide (2.0)
- Introduction
- Access Center
- Dashboard
- Alarm Management
- Metric Browsing
- Log Analysis (New)
- Log Analysis (Old)
- Application Insights (Retiring)
-
Prometheus Monitoring
- Prometheus Monitoring
- Creating Prometheus Instances
- Managing Prometheus Instances
- Configuring a Recording Rule
- Metric Management
- Dashboard Monitoring
- Data Multi-Write
-
Access Guide
- Connecting Node Exporter
- Connecting Self-Built Middleware in the CCE Container Scenario
-
Exporter Access in the VM Scenario
- Access Overview
- MySQL Component Access
- Redis Component Access
- Kafka Component Access
- Nginx Component Access
- MongoDB Component Access
- Consul Component Access
- HAProxy Component Access
- PostgreSQL Component Access
- Elasticsearch Component Access
- RabbitMQ Component Access
- Access of Other Components
- Custom Plug-in Access
- Other Operations
- Obtaining the Service Address of a Prometheus Instance
- Regions that Support Public Network Addresses for Remote Write
- Viewing Prometheus Instance Data Through Grafana
- Reading Prometheus Instance Data Through Remote Read
- Reporting Self-Built Prometheus Instance Data to AOM
- Resource Usage Statistics
- Business Monitoring (Beta)
- Infrastructure Monitoring
- O&M Management (Retiring)
- Settings
- Remarks
- Permissions Management
- Auditing
- Subscribing to AOM 2.0
- Upgrading to AOM 2.0
-
Best Practices (2.0)
- AOM Best Practices
- Building a Comprehensive Metric System
- Alarm Noise Reduction
- Unified Metric Monitoring
- Customizing OS Images to Automatically Connect UniAgent
- Connecting Self-Built Middleware in the CCE Container Scenario
- Interconnecting Third-Party/IDC/Huawei Cloud Cross-Region Self-Built Prometheus with AOM Prometheus Instances
-
FAQs (2.0)
- Dashboard
- Alarm Management
- Log Analysis
- Prometheus Monitoring
- Infrastructure Monitoring
- Application Monitoring
-
Collection Management
- Are ICAgent and UniAgent the Same?
- What Can I Do If an ICAgent Is Offline?
- Why Is an Installed ICAgent Displayed as "Abnormal" on the UniAgent Installation and Configuration Page?
- Why Can't I View the ICAgent Status After It Is Installed?
- Why Can't AOM Monitor CPU and Memory Usage After ICAgent Is Installed?
- How Do I Obtain an AK/SK?
- FAQs About UniAgent and ICAgent Installation
- How Do I Enable the Nginx stub_status Module?
- Why Does APM Metric Collection Fail?
- Why Cannot the Installation Script Be Downloaded When I Try to Install UniAgent on an ECS?
- CMDB (Unavailable Soon)
-
O&M Management (Unavailable Soon)
- How Can I Obtain the OBS Permission for Installing Packages?
- Why Can't Scheduled Tasks Be Triggered?
- Can I Specify Script Parameters and Hosts During Job Execution?
- Why Is a Parameter Error Displayed When I Create a Scheduled Task Using a Cron Expression?
- How Can I Set a Review for an Execution Plan?
- Why Is "delete success:{}" Displayed (Files Cannot Be Deleted) During Disk Clearance?
- What Can I Do If the Execution Plan Is Not Updated After I Modify the Job?
- What Can I Do If "agent not found" Is Displayed?
- Why Are the Hosts Listed in Execution Logs Inconsistent with Those I Configured for a Task?
- Why Did a Task Fail to Execute?
- Other FAQs
-
API Reference
- Before You Start
- API Overview
- Calling APIs
-
APIs
-
Alarm
- Querying the Event Alarm Rule List
- Adding an Event Alarm Rule
- Modifying an Event Alarm Rule
- Deleting an Event Alarm Rule
- Querying Events and Alarms
- Counting Events and Alarms
- Reporting Events and Alarms
- Obtaining the Alarm Sending Result
- Deleting a Silence Rule
- Adding a Silence Rule
- Modifying a Silence Rule
- Obtaining the Silence Rule List
- Querying an Alarm Action Rule Based on Rule Name
- Adding an Alarm Action Rule
- Deleting an Alarm Action Rule
- Modifying an Alarm Action Rule
- Querying the Alarm Action Rule List
- Querying Metric or Event Alarm Rules
- Adding or Modifying Metric or Event Alarm Rules
- Deleting Metric or Event Alarm Rules
-
Monitoring
- Querying Time Series Objects
- Querying Time Series Data
- Querying Metrics
- Querying Monitoring Data
- Adding Monitoring Data
- Adding or Modifying One or More Service Discovery Rules
- Deleting a Service Discovery Rule
- Querying Existing Service Discovery Rules
- Adding a Threshold Rule
- Querying the Threshold Rule List
- Modifying a Threshold Rule
- Deleting a Threshold Rule
- Querying a Threshold Rule
- Deleting Threshold Rules in Batches
-
Prometheus Monitoring
- Querying Expression Calculation Results in a Specified Period Using the GET Method
- (Recommended) Querying Expression Calculation Results in a Specified Period Using the POST Method
- Querying the Expression Calculation Result at a Specified Time Point Using the GET Method
- (Recommended) Querying Expression Calculation Results at a Specified Time Point Using the POST Method
- Querying Tag Values
- Obtaining the Tag Name List Using the GET Method
- (Recommended) Obtaining the Tag Name List Using the POST Method
- Querying Metadata
- Log
- Prometheus Instance
- Configuration Management
-
CMDB (AOM 2.0)
- Creating an Application
- Deleting an Application
- Querying the Details of an Application
- Modifying an Application
- Adding a Component
- Deleting a Component
- Querying the Details of a Component
- Modifying a Component
- Creating an Environment
- Deleting an Environment
- Querying the Details of an Environment
- Modifying an Environment
- Querying the Resource List of a Node
- Querying the Details of an Application Based on the Application Name
- Querying the Details of an Environment Based on the Environment Name
- Querying the Details of a Component Based on the Component Name
- Adding a Sub-application
- Deleting a Sub-application
- Modifying a Sub-application
-
Automation (AOM 2.0)
- Creating a Task
- Updating a Task
- Operating a Paused Task
- Obtaining the Execution Details of a Workflow
- Terminating a Task
- Querying a Script
- Querying the Script Version
- Performing Fuzzy Search on the Job Management Page
- Querying Execution Plans (Custom Templates) Based on Job ID
- Querying the Details of an Execution Plan
- Querying Tasks
- Querying the Execution History of a Task
- Executing a Workflow
-
Alarm
- Historical APIs
- Examples
- Permissions Policies and Supported Actions
- Appendix
- SDK Reference
-
Service Overview (1.0)
- What Is AOM?
- Product Architecture
- Functions
- Application Scenarios
- Edition Differences
-
Metric Overview
- Introduction
- Network Metrics and Dimensions
- Disk Metrics and Dimensions
- Disk Partition Metrics
- File System Metrics and Dimensions
- Host Metrics and Dimensions
- Cluster Metrics and Dimensions
- Container Metrics and Dimensions
- VM Metrics and Dimensions
- Instance Metrics and Dimensions
- Service Metrics and Dimensions
- Security
- Restrictions
- Privacy and Sensitive Information Protection Statement
- Relationships Between AOM and Other Services
- Basic Concepts
- Permissions
- Billing
- Change History
- Getting Started (1.0)
-
User Guide (1.0)
- Overview
- Subscribing to AOM
- Permissions Management
- Connecting Resources to AOM
- Monitoring Overview
- Alarm Management
- Resource Monitoring
- Log Management
- Configuration Management
- Resource Groups
- Auditing
- Upgrading to AOM 2.0
- Best Practices (1.0)
-
FAQs (1.0)
- User FAQs
-
Consultation FAQs
- What Is the Billing Policy of AOM?
- What Are the Usage Restrictions of AOM?
- What Are the Differences Between AOM and APM?
- How Do I Distinguish Alarms from Events?
- What Is the Relationship Between the Time Range and Statistical Cycle?
- Does AOM Display Logs in Real Time?
- Will Container Logs Be Deleted After They Are Dumped?
- How Can I Do If I Cannot Receive Any Email Notification After Configuring a Threshold Rule?
- Why Are Connection Channels Required?
-
Usage FAQs
- What Can I Do If I Do Not Have the Permission to Access SMN?
- What Can I Do If Resources Are Not Running Properly?
- How Do I Set the Full-Screen Online Duration?
- What Can I Do If the Log Usage Reaches 90% or Is Full?
- How Do I Obtain an AK/SK?
- How Can I Check Whether a Service Is Available?
- Why Is the Status of an Alarm Rule Displayed as "Insufficient"?
- Why the Status of a Workload that Runs Normally Is Displayed as "Abnormal" on the AOM Page?
- How Do I Create the apm_admin_trust Agency?
- How Do I Obtain the AK/SK by Creating an Agency?
- What Is the Billing Policy of Logs?
- Why Can't I See Any Logs on the Console?
- What Can I Do If an ICAgent Is Offline?
- Why Can't the Host Be Monitored After ICAgent Is Installed?
- Why Is "no crontab for root" Displayed During ICAgent Installation?
- Why Can't I Select an OBS Bucket When Configuring Log Dumping on AOM?
- Why Can't Grafana Display Content?
- Videos
-
More Documents
-
User Guide (1.0) (Kuala Lumpur Region)
-
Service Overview
- What Is AOM?
- Product Architecture
- Functions
- Application Scenarios
-
Metric Overview
- Introduction
- Network Metrics and Dimensions
- Disk Metrics and Dimensions
- Disk Partition Metrics
- File System Metrics and Dimensions
- Host Metrics and Dimensions
- Cluster Metrics and Dimensions
- Container Metrics and Dimensions
- VM Metrics and Dimensions
- Instance Metrics and Dimensions
- Service Metrics and Dimensions
- Restrictions
- Privacy and Sensitive Information Protection Statement
- Relationships Between AOM and Other Services
- Basic Concepts
- Permissions
- Getting Started
- Permissions Management
- Connecting Resources to AOM
- Monitoring Overview
- Alarm Management
- Resource Monitoring
- Log Management
- Configuration Management
- Auditing
- Upgrading to AOM 2.0
-
FAQs
- User FAQs
-
Consultation FAQs
- What Are the Usage Restrictions of AOM?
- What Are the Differences Between AOM and APM?
- How Do I Distinguish Alarms from Events?
- What Is the Relationship Between the Time Range and Statistical Cycle?
- Does AOM Display Logs in Real Time?
- How Can I Do If I Cannot Receive Any Email Notification After Configuring a Threshold Rule?
- Why Are Connection Channels Required?
-
Usage FAQs
- What Can I Do If I Do Not Have the Permission to Access SMN?
- What Can I Do If Resources Are Not Running Properly?
- How Do I Set the Full-Screen Online Duration?
- How Do I Obtain an AK/SK?
- How Can I Check Whether a Service Is Available?
- Why Is the Status of an Alarm Rule Displayed as "Insufficient"?
- Why the Status of a Workload that Runs Normally Is Displayed as "Abnormal" on the AOM Page?
- How Do I Create the apm_admin_trust Agency?
- What Can I Do If an ICAgent Is Offline?
- Why Is "no crontab for root" Displayed During ICAgent Installation?
- Change History
-
Service Overview
-
User Guide (2.0) (Kuala Lumpur Region)
- Service Overview
- Getting Started
- Introduction
- Access Center
- Dashboard
- Alarm Management
-
Metric Analysis
- Metric Browsing
- Prometheus Monitoring
- Resource Usage Statistics
- Log Analysis (Beta)
- Container Insights
- Infrastructure Monitoring
- Process Monitoring
- Collection Management
- Configuration Management
- Remarks
- Permissions Management
- Auditing
- Upgrading to AOM 2.0
-
FAQs
- Overview
- Dashboard
- Alarm Management
- Log Analysis
- Prometheus Monitoring
- Container Insights
- Application Monitoring
-
Collection Management
- Are ICAgent and UniAgent the Same?
- What Can I Do If an ICAgent Is Offline?
- Why Is an Installed ICAgent Displayed as "Abnormal" on the Agent Management Page?
- Why Can't I View the ICAgent Status After It Is Installed?
- Why Can't AOM Monitor CPU and Memory Usage After ICAgent Is Installed?
- How Do I Obtain an AK/SK?
- FAQs About ICAgent Installation
- Other FAQs
- Change History
-
API Reference (Kuala Lumpur Region)
- Before You Start
- API Overview
- Calling APIs
-
APIs
-
Alarm
- Querying the Event Alarm Rule List
- Adding an Event Alarm Rule
- Modifying an Event Alarm Rule
- Deleting an Event Alarm Rule
- Obtaining the Alarm Sending Result
- Deleting a Silence Rule
- Adding a Silence Rule
- Modifying a Silence Rule
- Obtaining the Silence Rule List
- Querying an Alarm Action Rule Based on Rule Name
- Adding an Alarm Action Rule
- Deleting an Alarm Action Rule
- Modifying an Alarm Action Rule
- Querying the Alarm Action Rule List
- Querying Events and Alarms
- Counting Events and Alarms
- Reporting Events and Alarms
-
Monitoring
- Querying Time Series Objects
- Querying Time Series Data
- Querying Metrics
- Querying Monitoring Data
- Adding Monitoring Data
- Adding or Modifying One or More Service Discovery Rules
- Deleting a Service Discovery Rule
- Querying Existing Service Discovery Rules
- Adding a Threshold Rule
- Querying the Threshold Rule List
- Modifying a Threshold Rule
- Deleting a Threshold Rule
- Querying a Threshold Rule
- Deleting Threshold Rules in Batches
- Log
-
Alarm
- Examples
- Permissions Policies and Supported Actions
- Appendix
- Change History
-
User Guide (ME-Abu Dhabi Region)
- Service Overview
- Getting Started
- User Guide
-
FAQs
- What Can I Do If an ICAgent Is Offline?
- Obtaining an AK/SK
- What Is the Relationship Between the Time Range and Statistical Cycle?
- What Can I Do If Resources Are Not Running Properly?
- How Can I Do If I Do Not Have the Permission to Access SMN?
- How Do I Distinguish Alarms and Events?
- Does AOM Display Logs in Real Time?
- How Can I Check Whether a Service Is Available?
- Why Is the Status of an Alarm Rule Displayed as "Insufficient"?
- Why the Status of a Workload that Runs Normally Is Abnormal on the AOM Page?
-
API Reference(ME-Abu Dhabi Region)
- Before You Start
- API Overview
- Calling APIs
-
APIs
-
Monitoring (v1)
- Querying Metrics
- Querying Monitoring Data
- Adding Monitoring Data
- Adding a Threshold Rule
- Modifying a Threshold Rule
- Querying the Threshold Rule List
- Querying a Threshold Rule
- Deleting a Threshold Rule
- Adding or Modifying One or More Application Discovery Rules
- Deleting an Application Discovery Rule
- Querying Application Discovery Rules
- Auto Scaling
- Log
-
Monitoring (v1)
- Permissions Policies and Supported Actions
- Appendix
-
User Guide (Ankara Region)
- Service Overview
- Getting Started
- User Guide
-
FAQs
- What Can I Do If an ICAgent Is Offline?
- How Do I Obtain an AK/SK?
- What Can I Do If Resources Are Not Running Properly?
- How Can I Do If I Do Not Have the Permission to Access SMN?
- How Do I Distinguish Alarms from Events?
- Does AOM Display Logs in Real Time?
- Why Is the Application Status Normal but the Component Status Abnormal?
- Best Practices
- Change History
-
API Reference (Ankara Region)
- Before You Start
- API Overview
- Calling APIs
-
APIs
-
Monitoring (v1)
- Querying Metrics
- Querying Monitoring Data
- Adding Monitoring Data
- Adding a Threshold Rule
- Modifying a Threshold Rule
- Querying the Threshold Rule List
- Querying a Threshold Rule
- Deleting a Threshold Rule
- Adding or Modifying One or More Application Discovery Rules
- Deleting an Application Discovery Rule
- Querying Application Discovery Rules
- Monitoring (v2)
- Auto Scaling
- Log
- Events/Alarms
- Agent
- Application Discovery Rules
-
Prometheus Monitoring
- Querying Expression Calculation Results in a Specified Period
- Querying the Expression Calculation Result at a Specified Time Point
- Querying Tag Values
- Obtaining the Tag Name List
- Querying Metadata
- Querying the Calculation Results of a PromQL Expression in a Specified Period Based on Prometheus Instance
- Querying the Calculation Result of a PromQL Expression at a Specified Time Point Based on Prometheus Instance
- Querying the Values of a Tag Based on Prometheus Instance
- Obtaining the Tag Name List Based on Prometheus Instance
- Querying Metadata Based on Prometheus Instance
-
Monitoring (v1)
- Appendix
- Change History
-
User Guide (1.0) (Kuala Lumpur Region)
- General Reference
Copied.
Configuring VM Log Collection Paths
AOM can collect and display VM logs. VM refers to an Elastic Cloud Server (ECS) or a Bare Metal Server (BMS) running Linux. To use this function, first configure a log collection path according to the following procedure.
Prerequisites
- You have installed an ICAgent on a VM according to Installing an ICAgent. Wait for about 5 minutes after the installation is complete. Then you can view the VM in the VM list on the Path Configuration page.
Precautions
- Ensure that your VMs are ECSs or BMSs running Linux.
- If you specify a directory, all .log, .trace, and .out text log files in this directory are collected by default. If you specify a log file, only this file is collected. The specified file must be a text file. Other types of log files, such as binary log files, cannot be collected.
- Ensure that an absolute path of a log directory or file is configured and the path exists. For example, /opt/yilu/work/xig or /opt/yilu/work/xig/debug_cpu.log.
- The ICAgent does not collect log files from subdirectories. For example, the ICAgent does not collect log files from the /opt/yilu/work/xig/debug subdirectory of /opt/yilu/work/xig.
- A maximum of 20 log collection paths can be configured for a VM.
- If the difference between the last modification time of a log file and the current time exceeds 12 hours, the log file will not be collected.
- For ECSs in the same resource set, logs will be collected based on the latest log collection configuration. AOM and LTS log collection configurations cannot take effect at the same time. For example, if you set log collection paths in AOM for ECSs, the previous LTS collection configurations of all ECSs under the resource set become invalid.
- When configuring the collection path of VM logs, do not use the log paths for mapping container service logs to VMs. Otherwise, the collected VM logs may be overwritten by container logs.
Configuring Log Collection Paths for a Single VM Through the Console
- Log in to the AOM console. In the navigation pane, choose Log > Path Configuration. The Host Log tab page is displayed.
- In the VM list, click Configure in the Operation column to configure one or more log collection paths for a VM.
You can use the paths automatically identified by the ICAgent or manually configure paths.
- Using the Paths Automatically Identified by the ICAgent
The ICAgent automatically scans the log files of your VM, and displays all the .log, .trace, or .out log files with handles and their paths on the page.
You can click
in the Operation column to add a path automatically identified by the ICAgent to the log collection path list. To configure multiple paths, repeat this operation.
Figure 1 Using the paths automatically identified by the ICAgent - Manually Configuring Log Collection Paths
If the paths automatically identified by the ICAgent cannot meet your requirements, enter a log directory or file (such as /opt/yilu/work/xig/debug_cpu.log or /opt/yilu/work/xig/*.log) in the Log Collection Path text box, and then click
to add the path to the log collection path list. To configure multiple paths, repeat this operation.
Figure 2 Manually configuring log collection paths
- Using the Paths Automatically Identified by the ICAgent
- Click OK.
Configuring Log Collection Paths for Multiple VMs in Batches Through the Console
You can configure log collection paths for multiple VMs in batches. When your service is deployed on multiple VMs, you can configure log collection paths in batches to reduce workload.
- Log in to the AOM console. In the navigation pane, choose Log > Path Configuration. The Host Log tab page is displayed.
- Configure one or more log collection paths for multiple VMs in batches.
Select one or more VMs in the list, click Batch Configure, and enter a log directory or file (for example, /opt/yilu/work/xig/debug_cpu.log) in the Log Collection Path text box. To configure multiple paths, click Add Log Collection Path.
Figure 3 Configuring log collection paths in batchesNOTE:
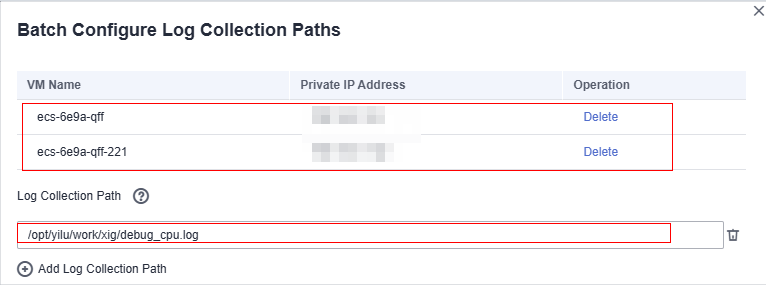
If you configure log collection paths for your VM and then configure log collection paths in batches, new paths will be added to the existing path list.
- Click OK.
In the VM list, click
in the Log Collection Path column to view the configured log collection paths of the VM.
Viewing VM Logs
After the log collection paths are configured, the ICAgent collects log files from them. This operation takes about 1 minute to complete. After collecting logs, you can perform the following operations:
- Viewing VM Log Files
In the navigation pane, choose Log > Log Files. Click the Host tab to view the collected log files. For details, see Viewing Log Files.
- Viewing and Analyzing VM logs
In the navigation pane, choose Log > Log Search. Click the Host tab to view and analyze the collected logs by time range, keyword, and context. For details, see Searching for Logs.
Feedback
Was this page helpful?
Provide feedbackThank you very much for your feedback. We will continue working to improve the documentation.See the reply and handling status in My Cloud VOC.
For any further questions, feel free to contact us through the chatbot.
Chatbot