
Viewing Statistics Reports
CNAD Advanced provides comprehensive reporting capabilities, allowing users to view data from both instance and protected object dimensions. These reports include traffic statistics, attack trends, and security events, offering valuable insights into the current network security posture.
Viewing the CNAD Report
- Log in to the AAD console.
- In the navigation pane on the left, choose . The Data Reports page is displayed.
Figure 1 Dashboard
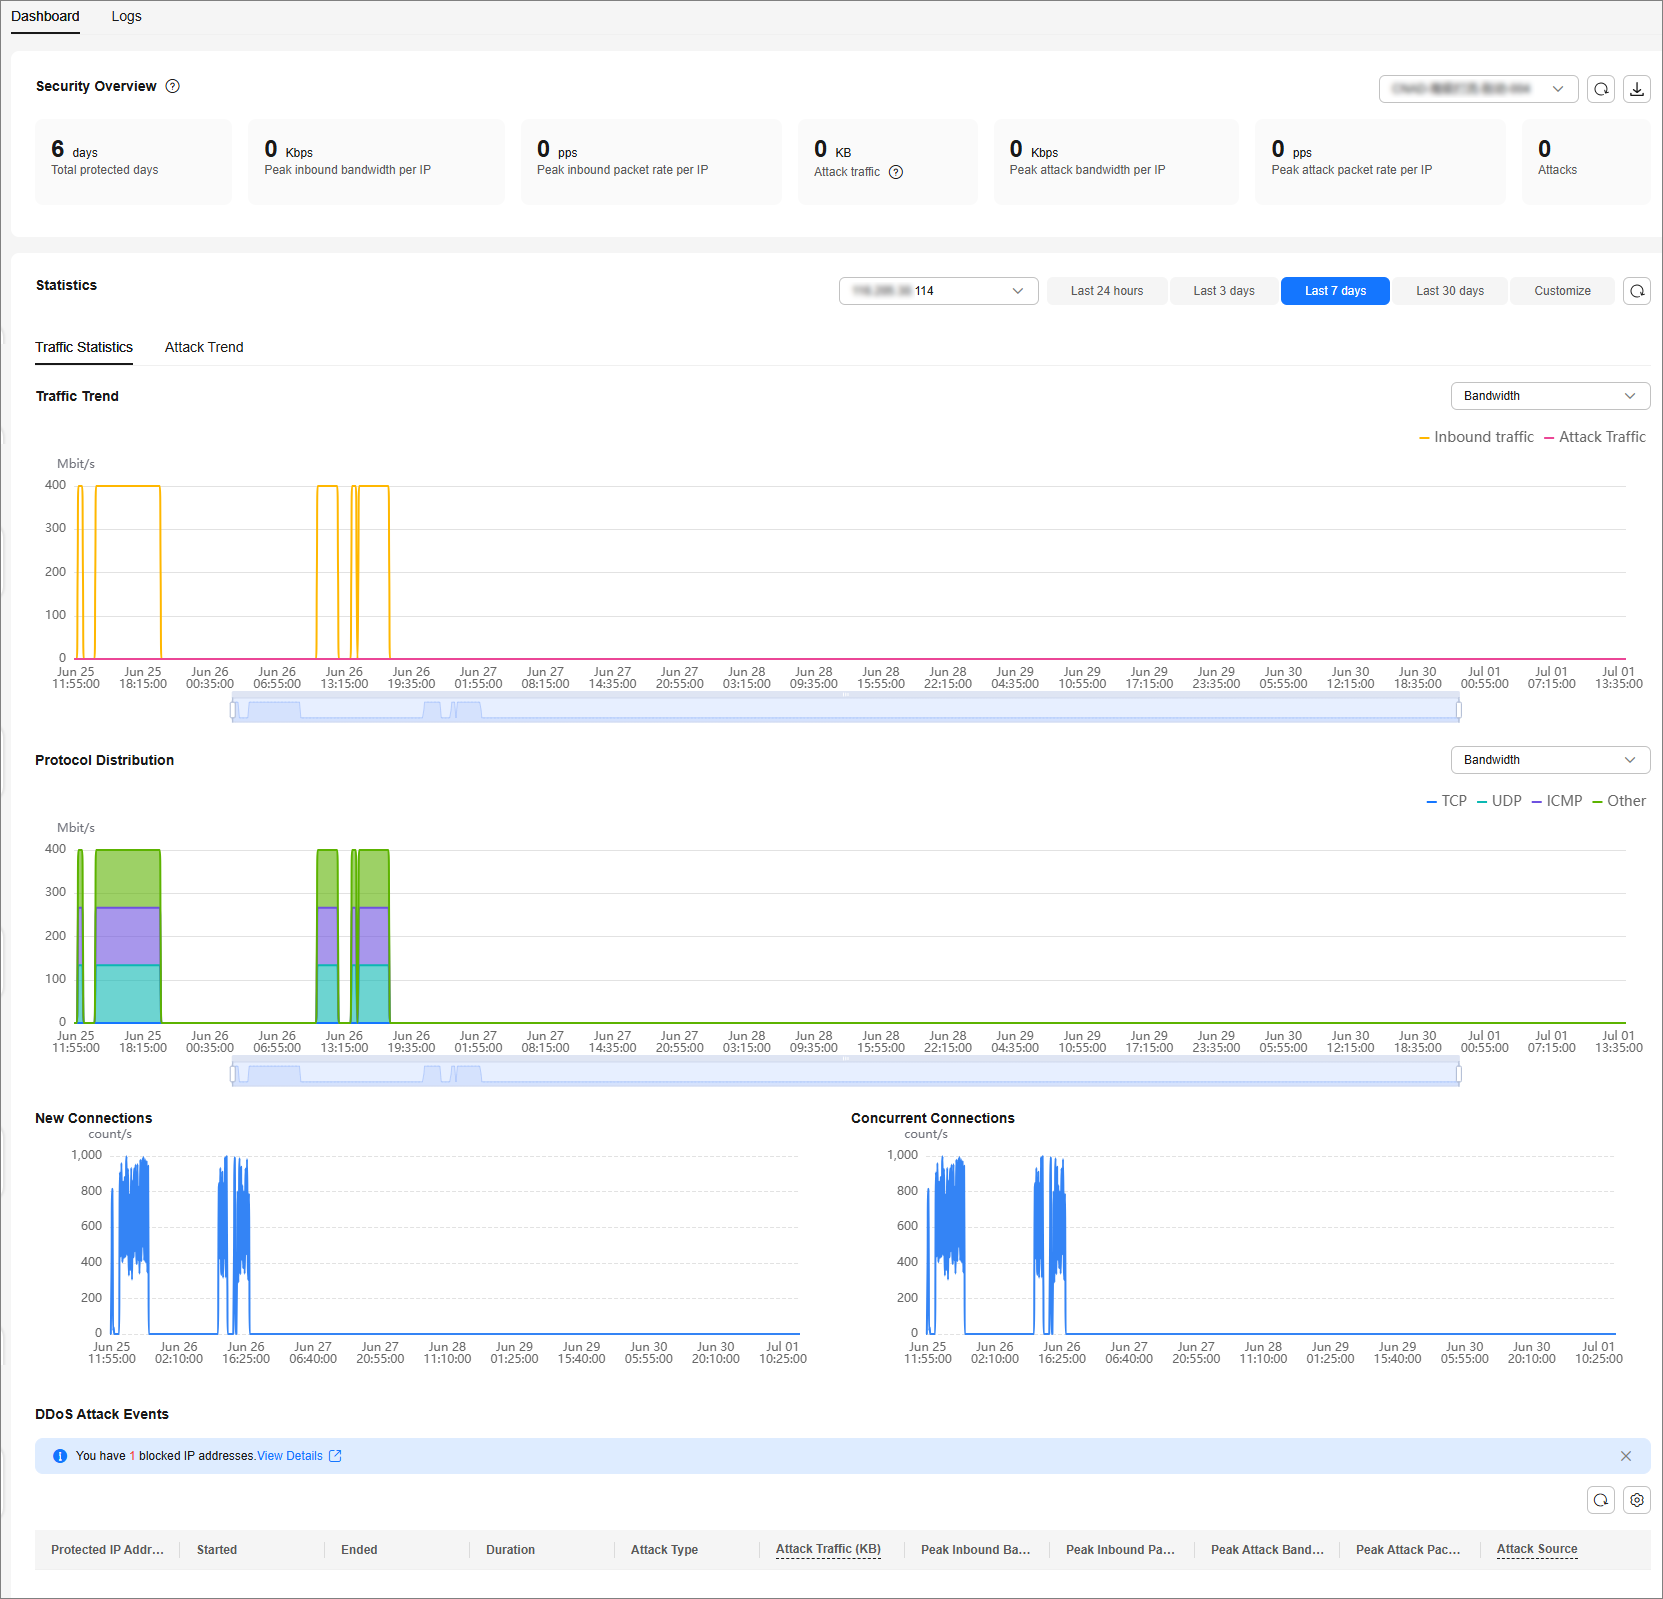
Table 1 Parameter description Parameter
Description
Total protected days
The cumulative number of days your instance has been continuously protected by CNAD Advanced since its creation.
Peak Inbound Bandwidth per IP
The highest recorded peak bandwidth for inbound traffic associated with a protected IP address over the entire lifecycle of the instance.
Peak inbound packet rate per IP
The highest recorded peak packet rate for inbound traffic associated with a protected IP address over the entire lifecycle of the instance.
Attack traffic
The total volume of traffic that has been successfully scrubbed by the Anti-DDoS Service throughout the instance's lifecycle.
Peak attack bandwidth per IP
The highest recorded peak bandwidth specifically for attack traffic that was scrubbed from a protected IP address over the instance's lifecycle.
Attack traffic refers to the traffic that is displayed in security events and is scrubbed by the Anti-DDoS Service.
Attacks
The cumulative count of all security events detected and recorded throughout the instance's lifecycle.
Traffic Trend
Displays trends for inbound traffic and attack traffic.
- All Protected Objects: Shows the average inbound traffic trend for the instance over the query period.
- Specified IP Address: Shows the peak inbound traffic and peak attack traffic for the selected IP address over the query period.
Protocol Distribution
Shows the distribution trend of inbound traffic for a specified IP address, categorized by protocol (TCP, UDP, ICMP, and Other) over the query period.
Concurrent Connections
Shows the trend of active concurrent connections for a specified IP address over the query period.
New Connections
Shows the trend of newly established connections for a specified IP address over the query period.
Attack Frequency Trend
Shows the daily trend of the number of attacks for an instance or a specific IP address over the query period.
Attack Traffic Trend
- All Protected Objects: Shows the peak bandwidth trend of attack traffic for all IP addresses protected by the instance over the query period.
- Specified IP Address: Displays the peak bandwidth trend of attack traffic for the selected IP address over the query period.
Attack Type Distribution
- By attack count: Shows the distribution of attack types by attack count.
- By peak attack traffic bandwidth: Shows the distribution of attack types by peak attack traffic bandwidth.
Top 10 Attacked IP Addresses
- By attack times: Shows the top 10 attacked IP addresses ranked by attack times.
- By peak attack traffic bandwidth: Shows the top 10 attacked IP addresses ranked by peak attack traffic bandwidth.
DDoS Attack Events
DDoS attack events Click Details next to the attack source IP address to view the attack source IP address list.

- For ongoing attack events, you can click View Dynamic Blacklist to view the blacklisted IP addresses that are in attack.
- The attack sources of ongoing attacks may not be displayed.
- Some attack events contain only some attack types. Their attack sources are not displayed.
- Attack sources are sampled randomly. Not all attack source information is displayed.
Related Operations
Downloading a report: Click  in the upper right corner of the page to download the data report to the local host.
Feedback
Was this page helpful?
Provide feedbackThank you very much for your feedback. We will continue working to improve the documentation.See the reply and handling status in My Cloud VOC.
For any further questions, feel free to contact us through the chatbot.
Chatbot


