Setting Up a Dashboard
Scenario
Dashboards, as powerful data analysis tools, are widely used in various fields such as operations monitoring, market analysis, and project management. They help management quickly grasp the business status and timely identify and resolve issues by displaying key indicators and data trends in real-time. This section guides you on how to connect DataArts Insight to a GaussDB(DWS) data source to set up dashboards for data analysis and visualization.
Procedure

|
No. |
Step |
Description |
|---|---|---|
|
1 |
Establish a project where all subsequent data analysis activities will occur, facilitating streamlined data management. |
|
|
2 |
Data sources form the backbone of data analysis. Ensuring successful connections to data sources is essential before commencing any data analysis. |
|
|
3 |
Datasets serve as an intermediary between data sources and the visual displays, receiving input from data sources and providing input for the visual displays. |
|
|
4 |
You can create a dashboard by adding various charts to display data from different dimensions and perform visual data analysis. |
|
|
5 |
After analyzing data, you can publish the dashboard or share it with others for collaborative editing. |
Data Description
To protect user privacy and data security, all data has been sampled and anonymized. In this example, there are three data tables: order_info_demo_01 (order table), product_info_demo_02 (product information table), and user_info_demo_03 (user data table). For details, see Table 2.
|
Data Table |
Field |
Type |
Description |
|---|---|---|---|
|
order_info_demo_01 |
id |
int |
ID |
|
sale_price |
int |
Sales price |
|
|
profit |
int |
Profit |
|
|
pay_time |
int |
Payment time |
|
|
create_time |
int |
Order creation time |
|
|
product_info_demo_02 |
product_id |
int |
ID |
|
product_name |
string |
Product name |
|
|
product_type |
string |
Product type |
|
|
product_color |
string |
Product color |
|
|
product_price |
string |
Product price |
|
|
user_info_demo_03 |
id |
int |
ID |
|
user_name |
int |
Username |
|
|
age |
int |
Age |
|
|
gender |
int |
Gender |
Step 1: Create a Project
- Log in to the DataArts Insight console.
- Click
 in the upper left corner of the management console to select a region and select an enterprise project from Enterprise Project in the lower left corner of the Workspace page.
 - Click Create Project in the right pane of the console.
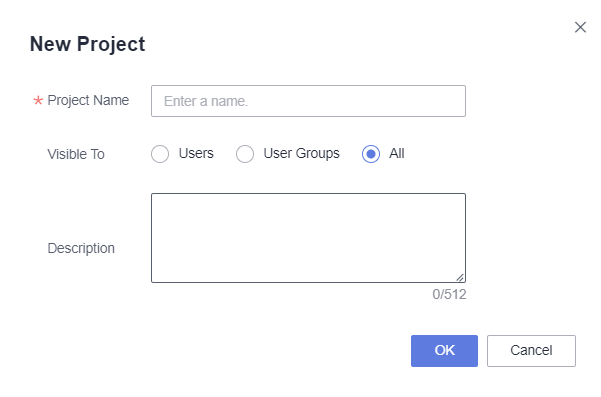
- Enter the project name, visible type, members, and description. See Figure 2.
- Set the parameters and click OK.
Step 2: Connect to a Data Source
In this example, a GaussDB(DWS) data source is connected through the public network..
- Select the desired project and click the name to access the project space.
- Choose Data Management > Data Sources. On the displayed page, click Create Data Source. In the slide-out panel, set Access Network Type to Public network. See Figure 3.
- Enter the name, domain name, port number, and database, and click Test Connection. For details about the parameters, see Table 3. Once the connection test is successful, the data source is successfully connected.
Table 3 Parameters Parameter
Mandatory
Description
Source Database Type
Yes
Type of the accessed data source. In this example, GaussDB(DWS) is selected.
Access Network Type
Yes
In this example, Public network is selected.
Name
Yes
Display name of the data source in the list.
Domain Name
Yes
IP address of the data source.
Port
Yes
Port number for logging in to the database.
Database
Yes
Name of the database to be logged in to.
SASL_SSL
-
It is used for trusted identity authentication and secure data transmission when DataArts Insight retrieves data from the data source. This function is enabled by default.
Username
Yes
Username for logging in to the database.
Password
Yes
Password for logging in to the database.
Step 3: Create a Dataset
- Select the desired project and click the name to access the project space.
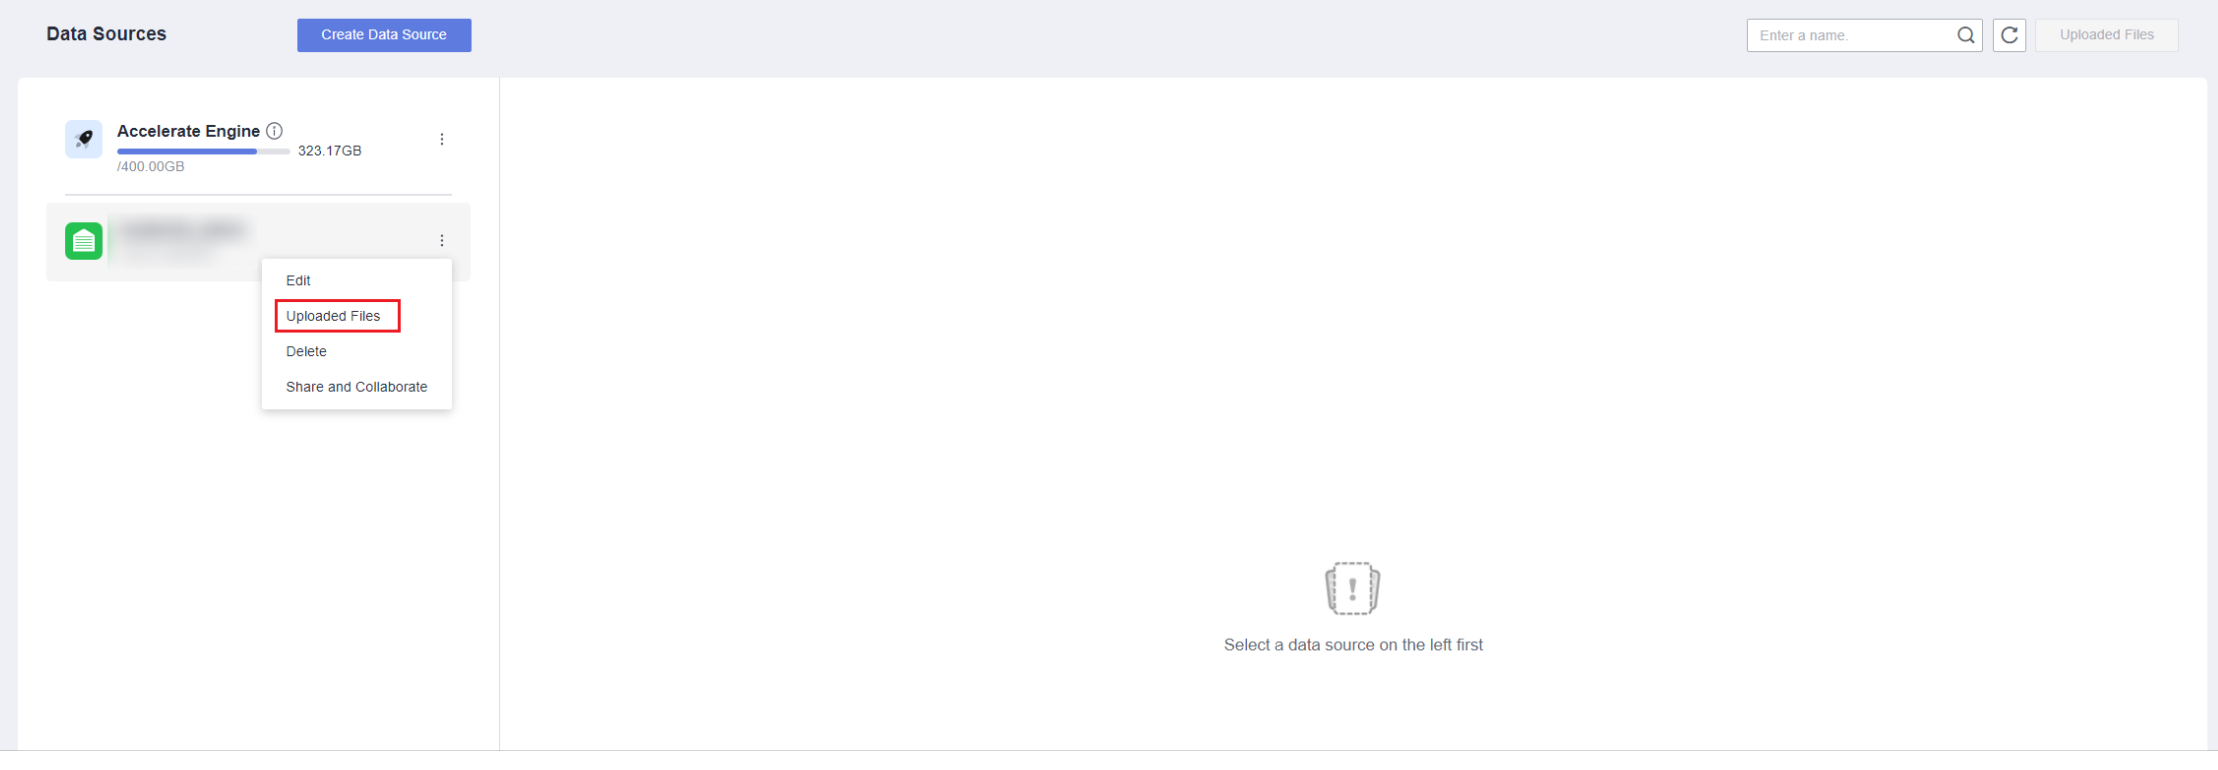
- Click
 next to the data source name and select Uploaded Files (Figure 4). Select the Excel file you want to upload, modify parameters as required, and click OK. Repeat this step to upload all data tables in sequence. In this example, there are three data tables. For details about the data tables, see Data Description.

Before uploading files, you need to configure the data storage bucket on the System Settings > OBS Bucket Settings page.
- Choose Data Management > Datasets. On the displayed page, click Create Dataset.
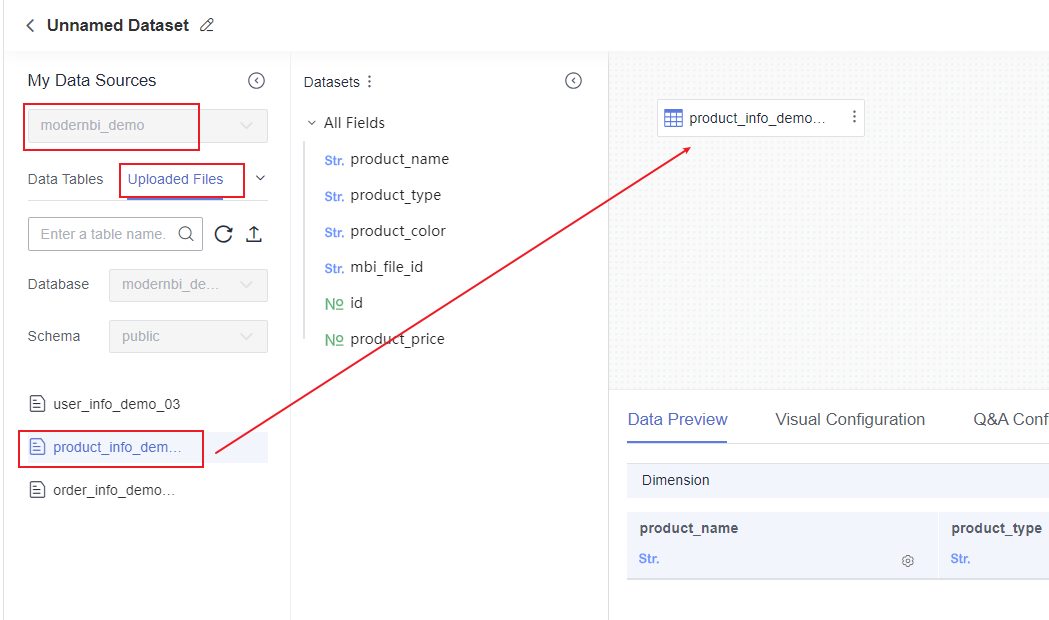
- Under My Data Sources, select the data source that is connected to in step 2. Click the Uploaded Files and double-click or drag a data table to add it to the operation panel.
Figure 5 Selecting a data table
- Double-click the data table name and set the table's association in the operation panel.
- Set up a left outer join between product_info_demo_02 and order_info_demo_01 using the id field as the key for the association.
- Set up a left outer join between product_info_demo_02 and user_info_demo_03 using the id field as the key for the association.
Figure 6 Creating a model by associating multiple tables
- Click the Visual Configuration tab and enter descriptions of the fields.
Figure 7 Visual configuration

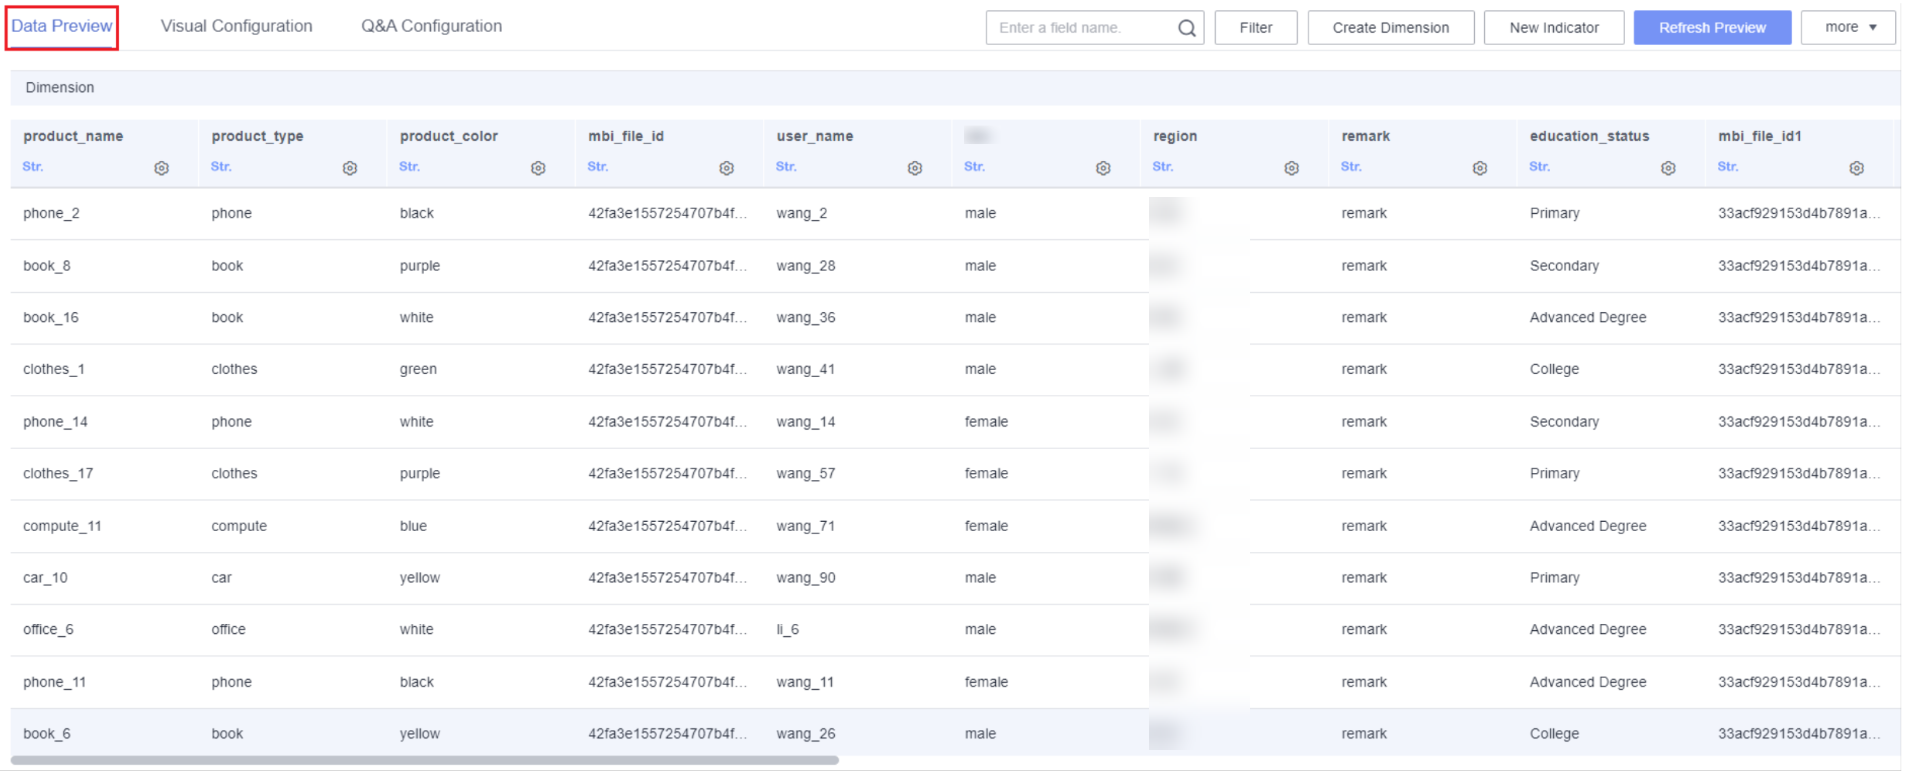
- Click the Data Preview tab and then Refresh Preview to view basic information about the dataset.
Figure 8 Data Preview tab
- Confirm the information and click Save.
Step 4: Create a Dashboard
In this example, we will create an area chart, pie chart, and table on a dashboard.
- Click the name of the desired project in the My Projects area in the right pane.
- In the navigation pane on the left, choose Data Analytics > Dashboard. On the displayed page, click Create Dashboard.
- In the Data area on the right, select a dataset. Then drag a dimension and metric to the Column area of the intelligent chart.
Figure 9 Selecting data
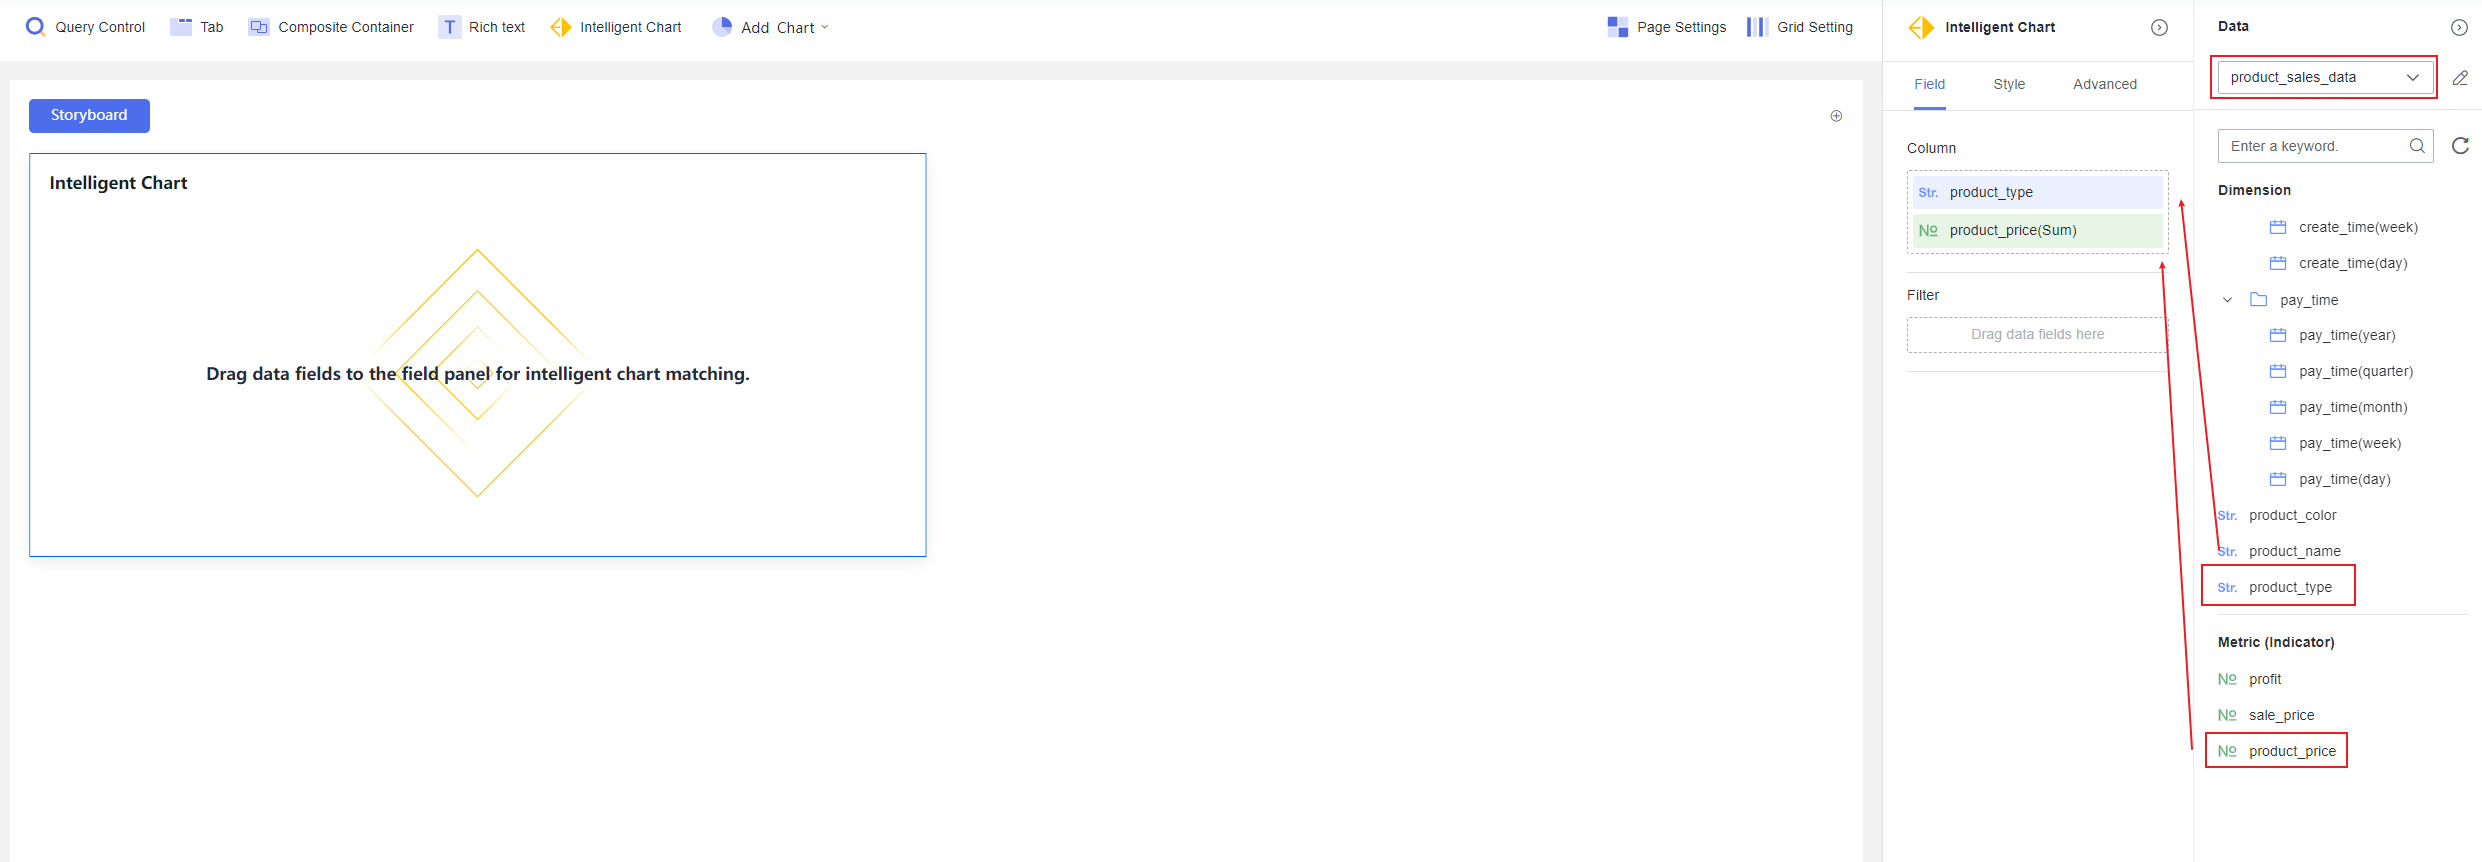
- Click Update. The system automatically generates a chart based on the selected data.
- Click
 in the upper right corner of intelligent chart, choose Switch chart type, and select the desired chart type. In this example, an area chart is selected.
Figure 10 Switching the chart type
- On the top menu, click Add Chart and select the required chart template. The pie chart is used as an example.
- In the Data area on the right of the page, select a dataset. Then drag dimensions and metrics to the Column area.
- Click Update. The pie chart is created. Create a table by following the same procedure.
Figure 11 Dashboard display
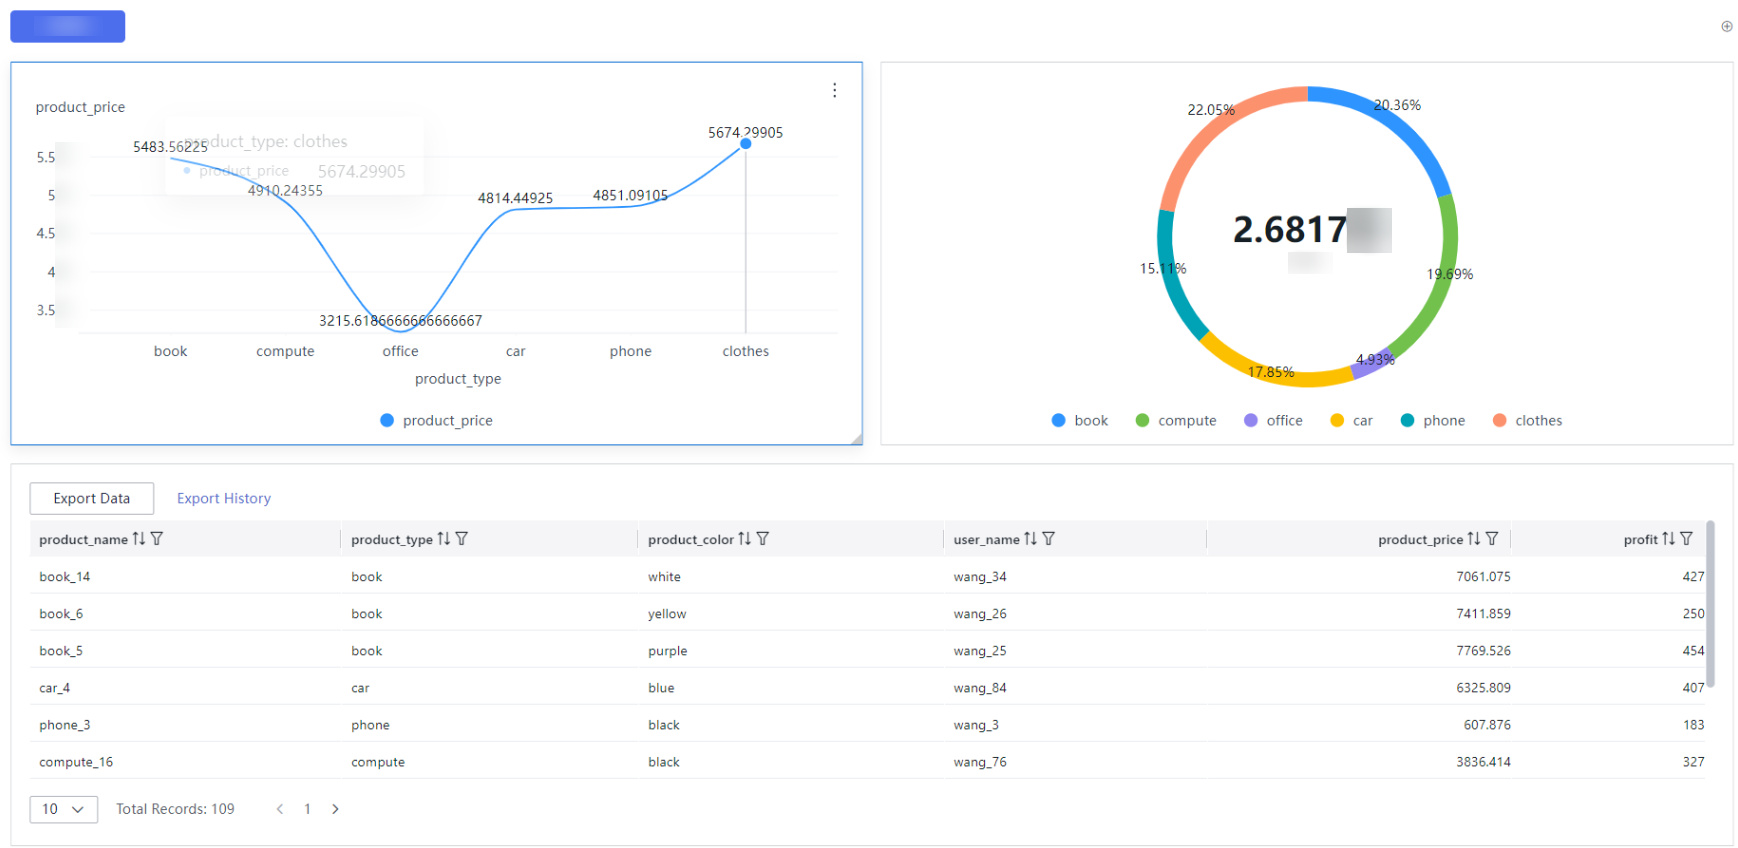
- Click Save in the upper right corner. In the dialog box that appears, enter a dashboard name, and click Confirm.
Step 5: Manage Dashboards
- Changing the dashboard publish status
- Click the name of the desired project in the My Projects area in the right pane.
- In the navigation pane on the left, choose Data Analytics > Dashboard.
- Click the name of the desired dashboard.
- Publishing the dashboard: Click Save and Publish in the upper right corner of the page.
- Taking the dashboard offline: Click
 in the upper right corner of the page and select Offline.
Figure 12 Changing the dashboard publish status
- Managing a published dashboard
You can edit, preview, view, share, and collaborate on published dashboards.
- Click the name of the desired project in the My Projects area in the right pane.
- In the navigation pane on the left, choose Data Analytics > Dashboard.
- On the displayed page, locate the dashboard you want to manage, and click Edit, Preview, Sharing and Collaboration, or Delete in its Operation column as needed.
Figure 13 Managing a published dashboard

- Managing a dashboard that has been taken offline
You can edit, preview, share, collaborate on, and delete dashboards that have been taken offline.
- Click the name of the desired project in the My Projects area in the right pane.
- In the navigation pane on the left, choose Data Analytics > Dashboard.
- On the displayed page, locate the dashboard you want to manage, and click Edit, Preview, Sharing and Collaboration, or Delete in its Operation column as needed.
Figure 14 Managing a dashboard that has been taken offline

Feedback
Was this page helpful?
Provide feedbackThank you very much for your feedback. We will continue working to improve the documentation.See the reply and handling status in My Cloud VOC.
For any further questions, feel free to contact us through the chatbot.
Chatbot

