
Viewing Protection Event Logs
For details about how to view attack traffic detected by the cloud firewall in attack logs, see Attack Event Logs.
You can also view all traffic allowed or blocked in access control logs to adjust access control policies. For details, see Access Control Logs.
Attack Event Logs
- Log in to the management console.
- Click
 in the upper left corner of the management console and select a region or project.
 - In the navigation pane on the left, click
 and choose . The Dashboard page will be displayed.
 - (Optional) If the current account has only one firewall instance, the firewall details page is displayed. If there are multiple firewall instances, click View in the Operation column to go to the details page.
- In the navigation pane, choose Log Audit > Log Query. The Attack Event Logs tab page is displayed. You can view details about attack events in the past week.
Figure 1 Attack event logs
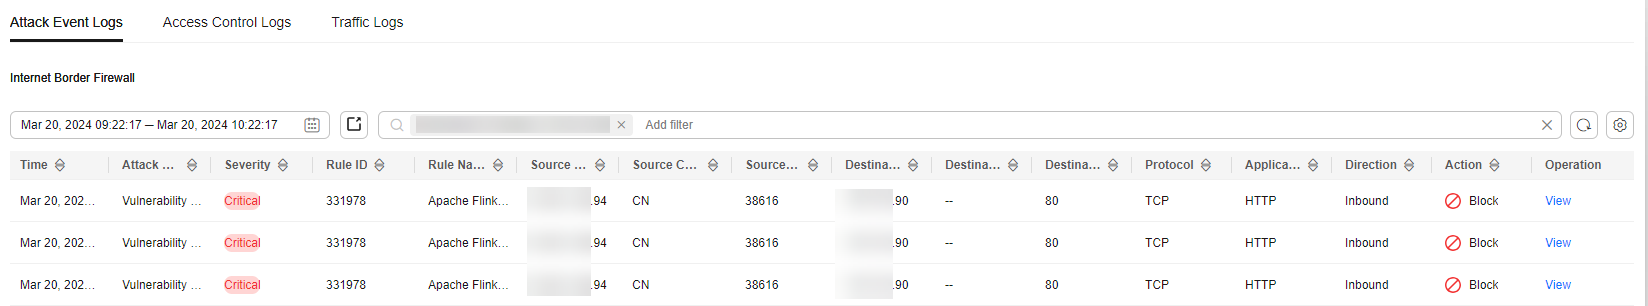
Table 1 Attack event log parameters Parameter
Description
Time
Time when an attack occurred.
Attack Type
Type of the attack event, including IMAP, DNS, FTP, HTTP, POP3, TCP, and UDP.
Severity
It can be Critical, High, Medium, or Low.
Rule ID
Rule ID
Rule Name
Matched rule in the library.
Source IP Address
Source IP address of an attack event.
Source Country/Region
Geographical location of the attack source IP address.
Source Port
Source port of an attack.
Destination IP Address
Attacked IP address.
Destination Country/Region
Geographical location of the attack target IP address.
Destination Port
Destination port of an attack.
Protocol
Protocol type of an attack.
Application
Application type of an attack.
Direction
It can be outbound or inbound.
Action
The value can be Allow, Block, Block IP, or Discard.
Operation
You can click View to view the basic information and attack payload of an event.
Access Control Logs
- Log in to the management console.
- Click in the upper left corner of the management console and select a region or project.
- In the navigation pane on the left, click and choose . The Dashboard page will be displayed.
- (Optional) If the current account has only one firewall instance, the firewall details page is displayed. If there are multiple firewall instances, click View in the Operation column to go to the details page.
- In the navigation pane, choose Log Audit > Log Query. Click the Access Control Logs tab and check the access control traffic details in the past week.
Figure 2 Access control logs
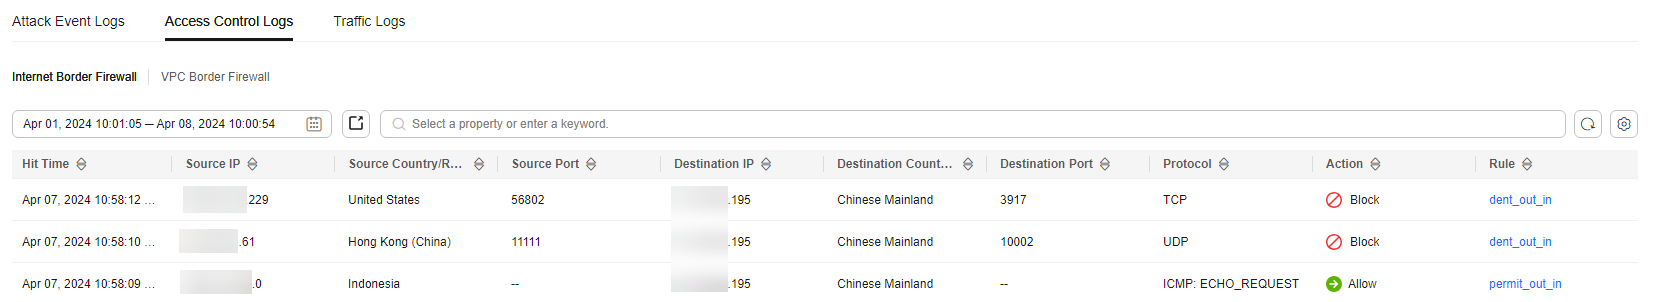
Table 2 Access control log parameters Parameter
Description
Hit Time
Time of access.
Source IP
Source IP address of the access.
Source Country/Region
Geographical location of the source IP address.
Source Port
Source port for access control. It can be a single port or consecutive port groups (example: 80-443).
Destination IP
Destination IP address.
Destination URL
Destination domain name
Destination Country/Region
Geographical location of the destination IP address.
Destination Port
Destination port for access control. It can be a single port or consecutive port groups (example: 80-443).
Protocol
Protocol type for access control.
Action
Action taken on an event. It can be Observe, Block, or Allow.
Rule
Type of an access control rule. It can be a blacklist or whitelist.
Feedback
Was this page helpful?
Provide feedbackThank you very much for your feedback. We will continue working to improve the documentation.See the reply and handling status in My Cloud VOC.
For any further questions, feel free to contact us through the chatbot.
Chatbot


