- What's New
-
Service Overview(2.0)
- What Is APM
- Functions
- Application Scenarios
- Basic Concepts
- Edition Differences
- Permissions Management
-
Metric Overview
- Exception
- Basic Monitoring
-
Databases
- C3P0 Connection Pool Monitoring
- Cassandra Monitoring
- ClickHouse Database
- DBCP Connection Pool Monitoring
- Druid Connection Pool Monitoring
- EsRestClient Monitoring
- GaussDB Database
- HBase Monitoring
- Hikari Connection Pool Monitoring
- Jetcd Monitoring
- MongoDB Monitoring
- MySQL Database
- ObsClient Monitoring
- Oracle Database
- PostgreSQL Database
- URLs
- External Calls
- Cache
- Agent Monitoring
- Tomcat Monitoring
- Message Queues
- RPC
- IoT
- Communication Protocol
- Privacy and Sensitive Information Protection Statement
- Data Collection
- Usage Restrictions
- Billing
- JavaAgent Updates
- Billing(2.0)
- Getting Started(2.0)
-
User Guide(2.0)
- Before You Start
- Application List
- CMDB Management
-
Application Metric Monitoring
- Overview
- Application Monitoring Details
-
Application Monitoring Configuration
- Configuration Details
- Configuring the MySQL Monitoring Item
- Configuring the HttpClient Monitoring Item
- Configuring the URL Monitoring Item
- Configuring the JavaMethod Monitoring Item
- Configuring the Druid Monitoring Item
- Configuring the ApacheHttpAsyncClient Monitoring Item
- Configuring the Redis Monitoring Item
- Configuring the Jedis Monitoring Item
- Configuring the HBase Monitoring Item
- Configuring the ApacheHttpClient Monitoring Item
- Configuring the Tomcat Monitoring Item
- Configuring the EsRestClient Monitoring Item
- Configuring the WebSocket Monitoring Item
- Configuring the KafkaProducer Monitoring Item
- Configuring the Hikari Monitoring Item
- Configuring the Exception Monitoring Item
- Configuring the Thread Monitoring Item
- Configuring the GC Monitoring Item
- Configuring the JVMInfo Monitoring Item
- Configuring the JVMMonitor Monitoring Item
- Configuring ProbeInfo Monitoring Item
- Monitoring Item Views
- Instance
- Collection Status
- Component Settings
- Tracing
- Application Topology
- URL Tracing
- Resource Tag Management
- Managing Tags
- Alarm Management
- AgentAgent Management
- Configuration Management
- System Management
- Permissions Management
- Change History
-
API Reference(2.0)
- Before You Start
- API Overview
- Calling APIs
- Examples
-
APIs
-
APM
- Querying the application list.
- Querying the Master Address
- Obtaining the AK/SK
- Searching for Components, Environments, and Agents in a Region
- Saving a Monitoring Item
- Querying the Monitoring Item List
- Querying All Agents of an Application
- Enabling or Disabling Collection for an Instance
- Deleting an Agent
- REGION
- CMDB
-
VIEW
- Querying Monitoring Item Configurations
- Querying the Trace Topology
- Querying Event Details
- Querying Span Data
- Obtaining All Data of a Trace
- Obtaining the Trend Graph
- Obtaining Summary Table Data
- Obtaining the Raw Data Table
- Obtaining Raw Data Details
- Obtaining the Instance Information
- Obtaining the Monitoring Item Information
- Obtaining the Details About a Monitoring Item
- AKSK
- ALARM
- TOPOLOGY
- TRANSACTION
- TRACING
-
APM
- Permissions Policies and Supported Actions
- Appendix
- Change History
- Best Practices(2.0)
- FAQs(2.0)
- Service Overview(1.0)
- Getting Started(1.0)
- Best Practices(1.0)
- User Guide
- API Reference
- SDK Reference
-
FAQs
- General FAQs
- Consultation FAQs
-
Usage FAQs
- How Do I Obtain the AK/SK and Project ID?
- How Do I Obtain the AK/SK by Creating an Agency?
- What Can I Do If No Data Is Found or the Data Is Abnormal?
- How Do I Connect APM to Non-Web Programs?
- How Are Tracing Time Lines Drawn?
- How Does APM Collect Probe Data?
- How Does APM Collect Mesh Data?
- How Do I Calculate the Number of Used Instances?
- How Do I Connect the JBoss Server in Standalone Mode to APM?
- What Can I Do If I Cannot Search for Logs Based on Trace IDs?
- How Do I Deploy APM Probes in CCE Containers?
- What Can I Do If the SSH Tunnel Process Is Abnormal?
- How Can I Do If No Topology or Data Is Displayed After the ICAgent and Java Probes Are Installed?
- Why Are Tomcat Thread Metrics Not Displayed on the JVM Monitoring Page?
- Why Is the Allocated Memory Greater Than the Preset Maximum Memory on the JVM Monitoring Page?
- How Do I Determine Whether an ICAgent Has Been Bound in CCE?
-
More Documents
- User Guide (ME-Abu Dhabi Region)
- API Reference (ME-Abu Dhabi Region)
-
User Guide (2.0) (Kuala Lumpur Region)
-
Service Overview
- What Is APM
- Functions
- Application Scenarios
- Basic Concepts
- Edition Differences
- Permissions Management
-
Metric Overview
- Metric Overview
- Exception
- Basic Monitoring
-
Databases
- C3P0 Connection Pool Monitoring
- Cassandra Monitoring
- ClickHouse Database
- DBCP Connection Pool Monitoring
- Druid Connection Pool Monitoring
- EsRestClient Monitoring
- GaussDB Database
- HBase Monitoring
- Hikari Connection Pool Monitoring
- Jetcd Monitoring
- MongoDB Monitoring
- MySQL Database
- ObsClient Monitoring
- Oracle Database
- PostgreSQL Database
- URLs
- External Calls
- Cache
- Agent Monitoring
- Tomcat Monitoring
- Message Queues
- RPC
- IoT
- Communication Protocol
- Privacy and Sensitive Information Protection Statement
- Data Collection
- Usage Restrictions
- Getting Started
-
User Guide
- Before You Start
- Application List
- CMDB Management
-
Application Metric Monitoring
- Overview
- Application Monitoring Details
-
Application Monitoring Configuration
- Configuration Details
- Configuring the MySQL Monitoring Item
- Configuring the HttpClient Monitoring Item
- Configuring the URL Monitoring Item
- Configuring the JavaMethod Monitoring Item
- Configuring the Druid Monitoring Item
- Configuring the ApacheHttpAsyncClient Monitoring Item
- Configuring the Redis Monitoring Item
- Configuring the Jedis Monitoring Item
- Configuring the HBase Monitoring Item
- Configuring the ApacheHttpClient Monitoring Item
- Configuring the Tomcat Monitoring Item
- Configuring the EsRestClient Monitoring Item
- Configuring the WebSocket Monitoring Item
- Configuring the KafkaProducer Monitoring Item
- Configuring the Hikari Monitoring Item
- Configuring the Exception Monitoring Item
- Configuring the Thread Monitoring Item
- Configuring the GC Monitoring Item
- Configuring the JVMInfo Monitoring Item
- Configuring the JVMMonitor Monitoring Item
- Configuring ProbeInfo Monitoring Item
- Monitoring Item Views
- Tracing
- Application Topology
- URL Tracing
- Resource Tag Management
- Managing Tags
- Alarm Management
- Agent Management
- Configuration Management
- System Management
- Permissions Management
- FAQs
- Change History
-
Service Overview
- General Reference
Copied.
Application Scenarios
APM is widely used. You can learn how to use APM based on the following typical application scenarios.
Diagnosis of Application Exceptions
Pain Points
In the distributed microservice architecture, enterprises can develop diverse complex applications efficiently. However, this architecture poses great challenges to traditional O&M and diagnosis technologies. In the example of an e-commerce application, problems are as follows:
- Difficult fault locating
After receiving the feedback from customers, customer service personnel submit problems to technical personnel for troubleshooting. In the distributed microservice architecture, a request usually undergoes multiple services/nodes before a result is returned. If a fault occurs, O&M personnel need to repeatedly view logs on multiple hosts to locate the fault. Even for simple problems, troubleshooting requires cooperation from multiple teams.
- Difficult architecture sort-out
When service logic becomes complex, it is difficult to find out the downstream services (databases, HTTP APIs, and caches) that an application depends on, and external services that depend on the application from the code perspective. It is also difficult to sort out the service logic, manage the architecture, and plan capacities. For example, enterprises find it hard to determine the number of hosts required for online promotions.
Service Implementation
APM can diagnose exceptions in large distributed applications. When an application breaks down or a request fails, you can locate faults in minutes through topologies and drill-downs.
- Visible topology: Abnormal application instances can be automatically discovered on the topology.
- Tracing: You can locate root causes in code through drill-downs after identifying abnormal applications on the topology.
- SQL analysis: APM displays graphs of key metrics (such as number of SQL statement calls, latency, and number of errors), and supports analysis of database performance problems caused by abnormal SQL statements.
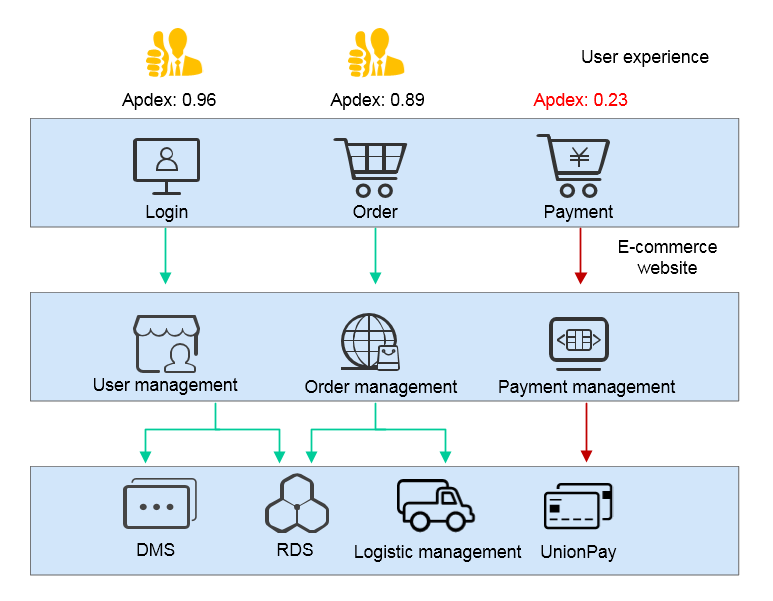
User Experience Management
Pain Points
In the Internet era where user experience is of crucial importance, you cannot obtain user access information even if backend services run stably. It is much more difficult to locate frontend problems that occur occasionally. After a system goes online, if users cannot access the system due to errors and you fail to obtain the information in time, you will lose lots of users. If users report page usage problems, how can these problems be reproduced immediately? How can error details be obtained for fast troubleshooting?
Service Implementation
APM provides experience management capabilities. Specifically, it analyzes the complete process (user request > server > database > server > user request) of application transactions in real time, and provides Apdex scores, enabling you to monitor comprehensive user experience in real time. For transactions with poor user experience, locate problems through topologies and tracing.
- Application KPI analysis: KPIs such as throughput, latency, and call success rate are displayed, so that you can monitor user experience easily.
- Full-link performance tracing: Web services, caches, and databases are traced, so that you can detect performance bottlenecks quickly.
Intelligent Diagnosis
Pain Points
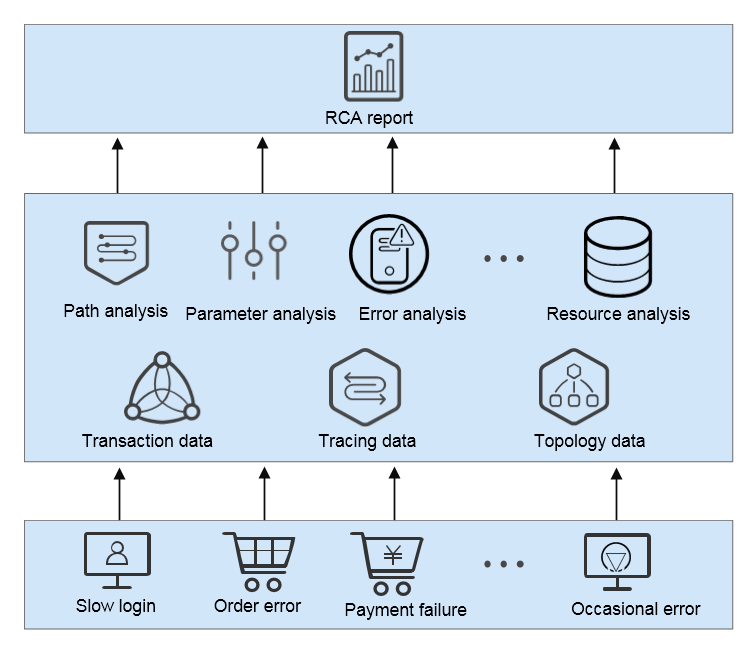
For massive quantities of services, there is rich but unassociated application O&M data, such as hundreds of monitoring metrics, KPI data, and tracing data. How can the system associate metric and alarm data from multiple perspectives (such as applications, services, instances, hosts, and transactions), and automatically complete RCA? How can intelligence analysis be made and possible causes be provided based on the learned historical data and O&M experience library?
Service Implementation
APM supports automatic detection of faults using machine learning algorithms, and intelligent diagnosis. When an exception occurs in a transaction, APM learns historical metric data based on intelligent algorithms, associates exception metrics for multi-dimensional analysis, extracts characteristics of context data (such as resources, parameters, and call structures) when services are normal and abnormal, and locate root causes through cluster analysis. APM can collect and compare the historical data about good and poor experience, and record the environment data that may cause application errors, including input and output parameters, tracing, resource data, and JVM parameters. Based on the Enterprise Intelligent (EI) engine, APM can train historical data online and make predictions.
Feedback
Was this page helpful?
Provide feedbackThank you very much for your feedback. We will continue working to improve the documentation.See the reply and handling status in My Cloud VOC.
For any further questions, feel free to contact us through the chatbot.
Chatbot