
Help Center/
Graph Engine Service/
User Guide (Kuala Lumpur Region)/
Accessing and Analyzing Graph Data/
Statistics Display
Updated on 2023-03-03 GMT+08:00
Statistics Display
Scenario
To view the number of tags and vertex weights of specified vertices and edges, you can select the vertices and edges in the canvas. For details about the concepts of vertices and edges, see Graph Data Formats.
Procedure
- Log in to the GES graph editor. For details, see Accessing the GES Graph Editor.
- Click
 on the right side of the canvas. The Filter, Property, and Statistics tabs are displayed. Click the Statistics tab.
- Tags: Statistics on all tags, and the number of vertices and edges of each tag on the current canvas
- Top 10 Vertex Weight: Top 10 vertices with the largest number of edges in the current graph
In the following example, there are two tags: user and movie. There are 100 vertices tagged with user and 46 vertices tagged with movie.
In the example graph, the vertex whose ID is 13 has the largest weight. There are 55 edges in total. The vertex ranked at 10 is vertex 97. There are 42 edges in total.
Figure 1 Tag statistics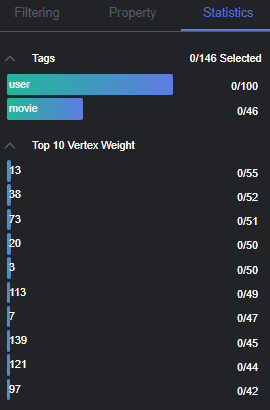
- Press Shift and drag the left key of the mouse to select vertices and edges in the graph. The tags of the selected vertices and edges are displayed along with the top 10 vertices with the highest weights among the selected verities.
Parent topic: Accessing and Analyzing Graph Data
Feedback
Was this page helpful?
Provide feedbackThank you very much for your feedback. We will continue working to improve the documentation.See the reply and handling status in My Cloud VOC.
The system is busy. Please try again later.
For any further questions, feel free to contact us through the chatbot.
Chatbot


