
Service Monitoring
View the monitoring information about streaming domain names, including CDN Downstream Bandwidth/Traffic, CDN Status Codes returned in responses, CDN Concurrent Downstream Requests, Transcoding Metrics, and Packaging Metrics.
Notes
Bandwidth/Bitrate is counted by 1,000 (example: 1 Mbit/s = 1,000 Kbit/s) and traffic by 1,024 (example: 1 MB = 1,024 KB).
Procedure
- Log in to the Live console.
- In the navigation pane on the left, choose Service Monitoring under Media Live.
- Select CDN Downstream Bandwidth/Traffic, CDN Status Code, CDN Concurrent Downstream Requests, Transcoding Metrics, or Packaging Metrics to view the statistics.
Move the cursor to the trend chart and scroll the mouse wheel to zoom in or zoom out the X axis (time).
CDN Downstream Bandwidth/Traffic

- You can query data of the past 90 days.
- You can query data in a time span of up to 31 days.
- You can query data about up to 20 domain names at a time.
- The minimum statistical granularity is 5 minutes. For example, data generated from November 6, 2020 08:00:00 (GMT+08:00) to November 6, 2020 08:04:59 (GMT+08:00) is displayed at the statistical point November 6, 2020 08:00:00 (GMT+08:00). The displayed data is the maximum value in the period of the selected granularity.
- Constraints on the statistical granularity: If the query time span is no longer than 2 days, the Every 1 day granularity is not supported. If the query time span is longer than 2 days and no longer than 7 days, the Every 5 minutes granularity is not supported. If the query time span is longer than 7 days, only the Every 1 day granularity is supported.
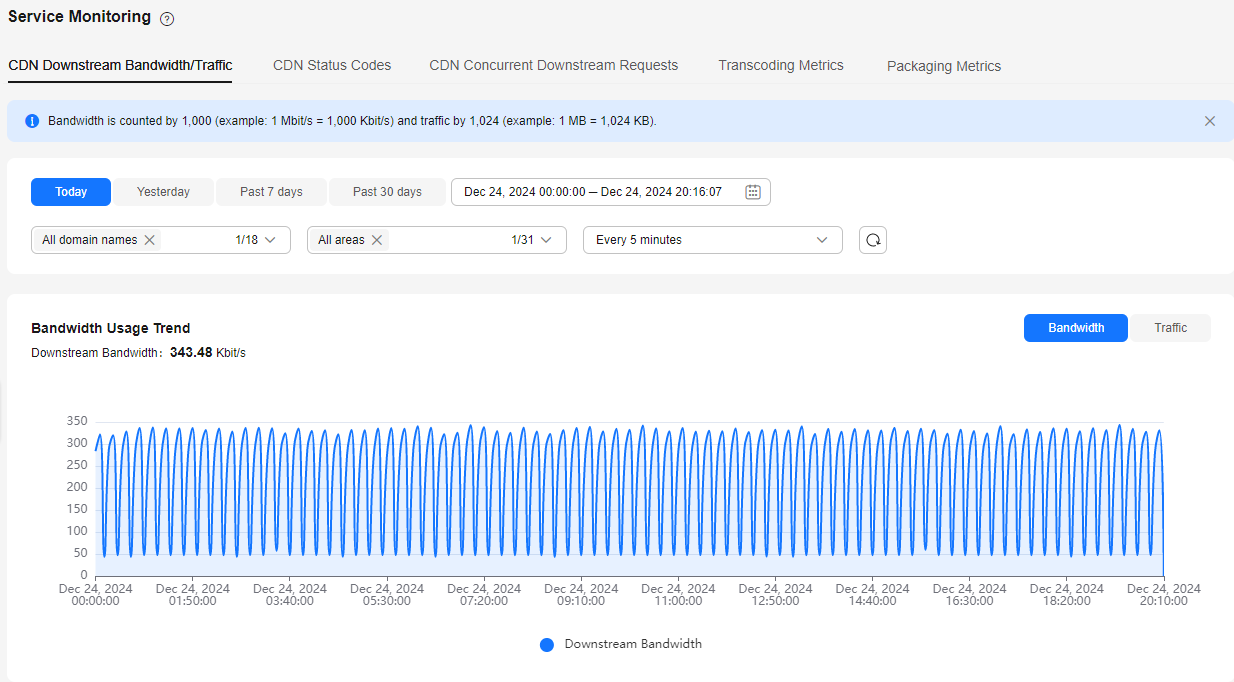
- Bandwidth Usage Trend displays the bandwidth usage trend of the selected domain name, as shown in Figure 1. Downstream Bandwidth: 2.00 Mbit/s indicates the downstream peak bandwidth of the selected domain name in the query period.
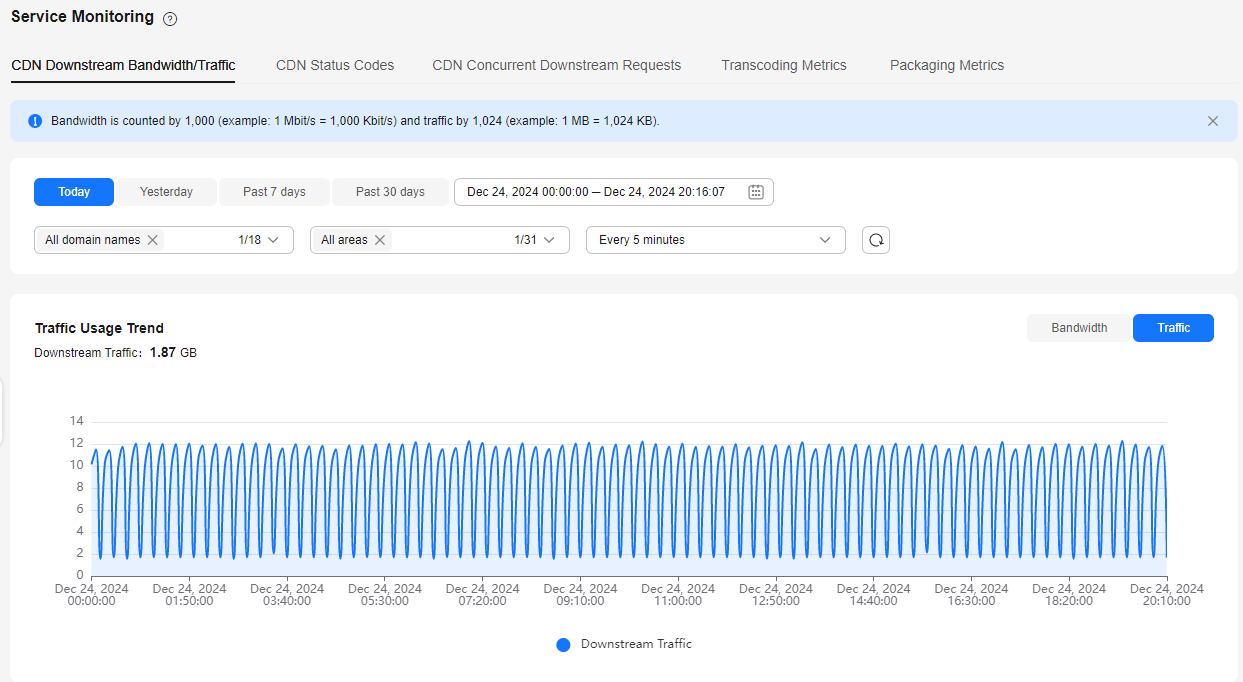
- Traffic Usage Trend displays the traffic usage trend of the selected domain name, as shown in Figure 2. Downstream Traffic: 2.50 GB indicates the traffic consumed by the selected domain name in the query period.
CDN Status Code
- You can query data of the past 90 days.
- You can query data in a time span of up to 31 days.
- You can query data about up to 20 domain names at a time.
- The minimum statistical granularity is 5 minutes. For example, data generated from November 6, 2020 08:00:00 (GMT+08:00) to November 6, 2020 08:04:59 (GMT+08:00) is displayed at the statistical point November 6, 2020 08:00:00 (GMT+08:00). The displayed data is the maximum value in the period of the selected granularity.
- Constraints on the statistical granularity: If the query time span is no longer than 2 days, the Every 1 day granularity is not supported. If the query time span is longer than 2 days and no longer than 7 days, the Every 5 minutes granularity is not supported. If the query time span is longer than 7 days, only the Every 1 day granularity is supported.
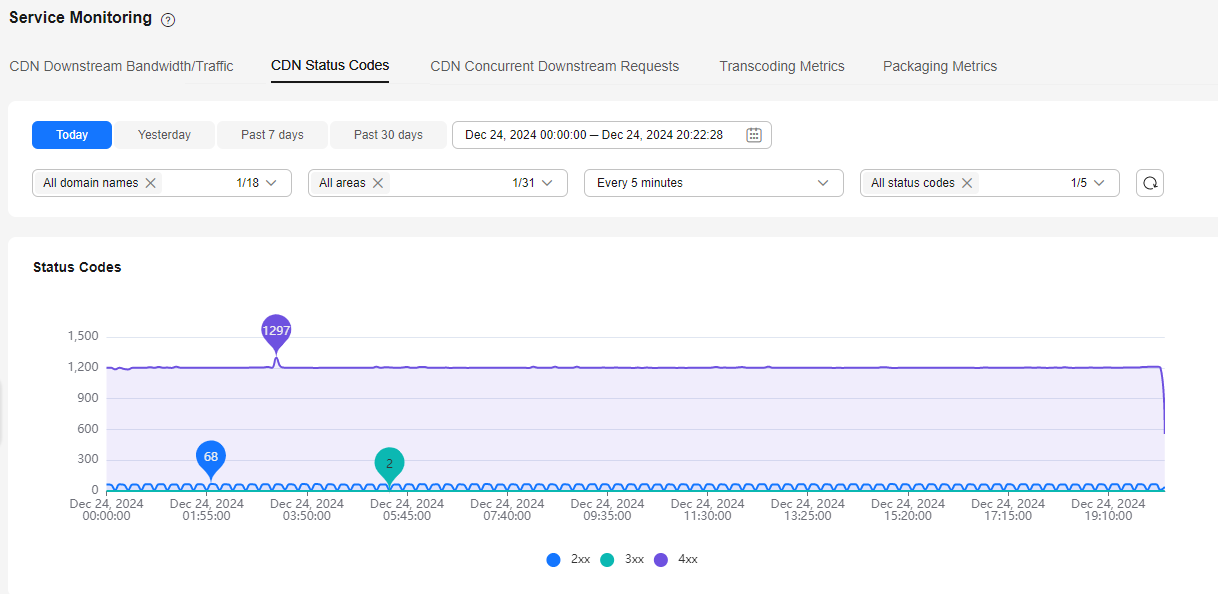
You can specify the time, streaming domain name, area, statistical granularity, and status code to view the trend chart of the corresponding status code, as shown in Figure 3.
The trend chart displays the number of status codes returned by the server.
CDN Concurrent Downstream Requests
- You can query data of the past 90 days.
- You can query data in a time span of up to 31 days.
- You can query data about up to 20 domain names at a time.
- The minimum statistical granularity is 5 minutes. For example, data generated from November 6, 2020 08:00:00 (GMT+08:00) to November 6, 2020 08:04:59 (GMT+08:00) is displayed at the statistical point November 6, 2020 08:00:00 (GMT+08:00). The displayed data is the maximum value in the period of the selected granularity.
- Constraints on the statistical granularity: If the query time span is no longer than 2 days, the Every 1 day granularity is not supported. If the query time span is longer than 2 days and no longer than 7 days, the Every 5 minutes granularity is not supported. If the query time span is longer than 7 days, only the Every 1 day granularity is supported.
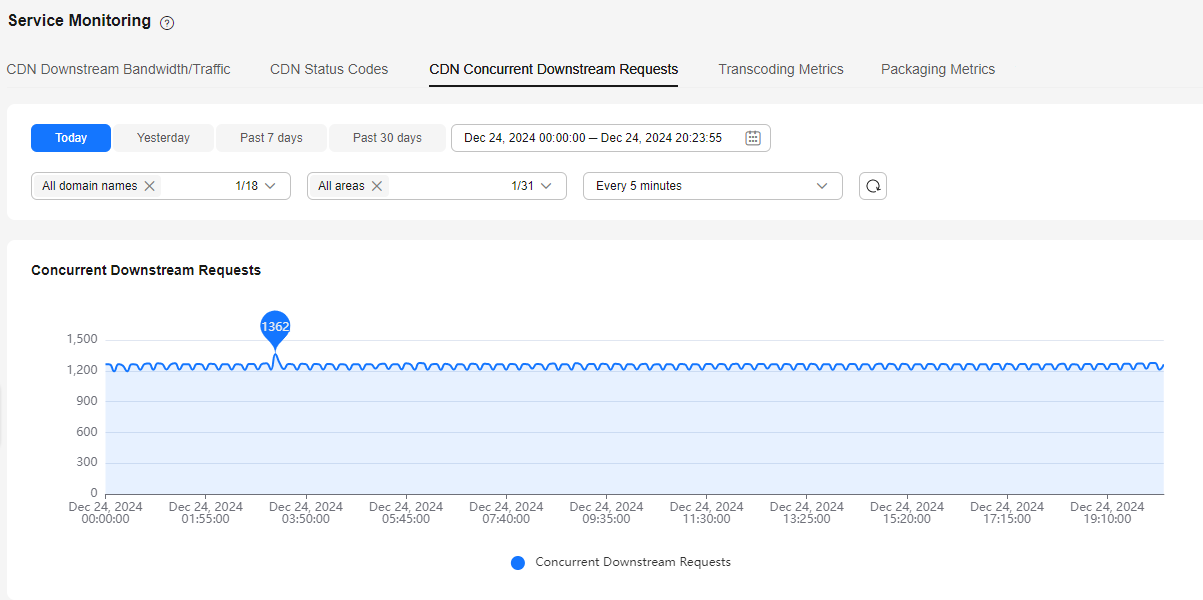
You can specify the time, streaming domain name, area, and statistical granularity to view the trend chart of the corresponding downstream concurrent requests.
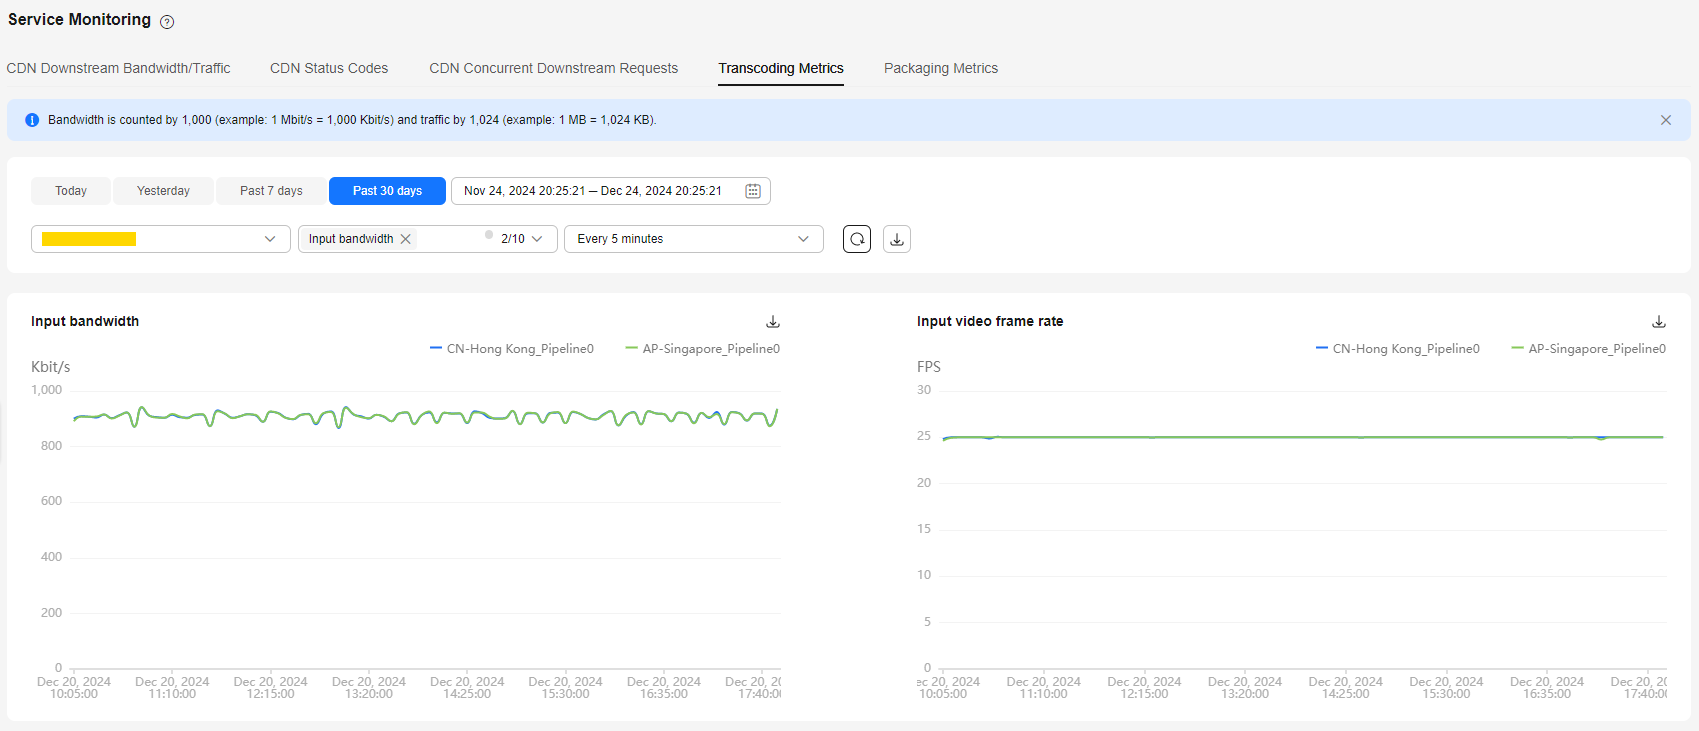
Transcoding Metrics
- You can query data of the past 90 days.
- You can query data in a time span of up to 30 days.
- The minimum statistical granularity of Transcoding Metrics is 1 minute. For example, data generated from November 6, 2020 08:00:00 (GMT+08:00) to November 6, 2020 08:00:59 (GMT+08:00) is displayed at the statistical point November 6, 2020 08:00:00 (GMT+08:00). The displayed data is the maximum value in the period of the selected granularity.
Select the time, channel name, transcoding metric name (Input bandwidth, Input video frame rate, Input disconnections, Dropped packets, Input switches for failover, Continuity errors, PID errors, Dropped frames, Duration of input without received packets, and Output bandwidth), and statistical granularity to view the trend chart of the input quality.
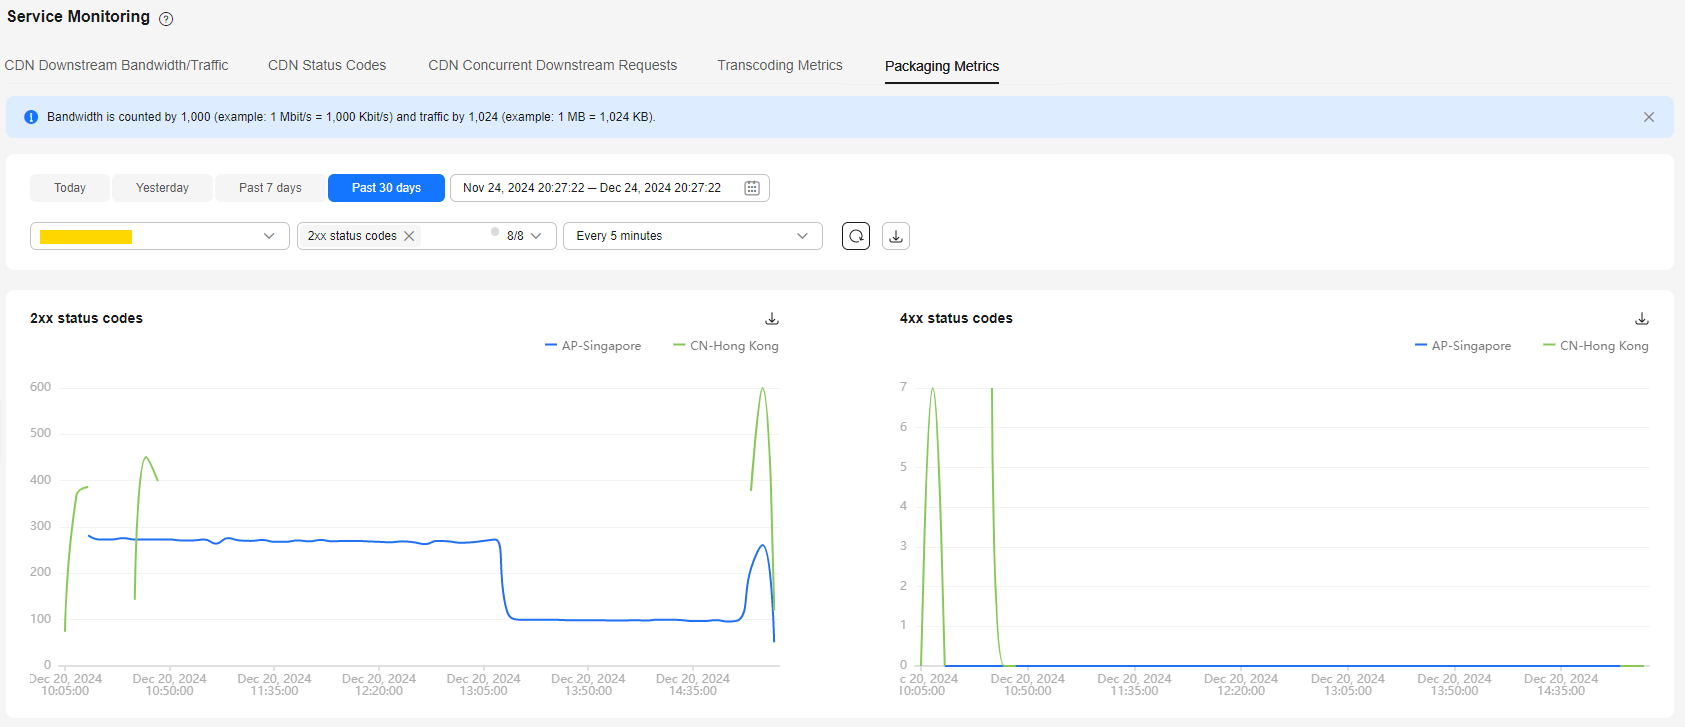
Packaging Metrics
- You can query data of the past 90 days.
- You can query data in a time span of up to 30 days.
- The minimum statistical granularity of Packaging Metrics is 1 minute. For example, data generated from November 6, 2020 08:00:00 (GMT+08:00) to November 6, 2020 08:00:59 (GMT+08:00) is displayed at the statistical point November 6, 2020 08:00:00 (GMT+08:00). The displayed data is the maximum value in the period of the selected granularity.
Select the time, channel name, packaging metric name (2xx status codes, 4xx status codes, 5xx status codes, HLS requests, DASH requests, MSS requests, Input traffic, and Output traffic), and statistical granularity to view the trend chart of the input quality.
Feedback
Was this page helpful?
Provide feedbackThank you very much for your feedback. We will continue working to improve the documentation.See the reply and handling status in My Cloud VOC.
For any further questions, feel free to contact us through the chatbot.
Chatbot


