Viewing CTS Traces in the Trace List
Scenarios
Cloud Trace Service (CTS) records operations performed on cloud service resources. A record contains information such as the user who performed the operation, IP address, operation content, and returned response message. These records facilitate security auditing, issue tracking, and resource locating. They also help you plan and use resources, and identify high-risk or non-compliant operations.
What Is a Trace?
A trace is an operation log for a cloud service resource, tracked and stored by CTS. Traces record operations such as adding, modifying, or deleting cloud service resources. You can view them to identify who performed operations and when for detailed tracking.
Viewing Traces in the Trace List
- Log in to the management console, click
 in the upper left corner, and choose Management & Deployment > Cloud Trace Service.
 - In the navigation pane, choose Trace List.
- In the upper right corner of the page, set a desired query time range: Last 1 hour, Last 1 day, or Last 1 week. You can also click Customize to specify a custom time range within the last seven days.
- Set filters to search for your desired traces.
Table 1 Trace filtering parameters Parameter
Description
Trace Type
Select Management or Data.
- Management traces record operations performed by users on cloud service resources, including creation, modification, and deletion.
- Data traces are reported by OBS and record operations performed on data in OBS buckets, including uploads and downloads.
Trace Source
Select the name of the cloud service that triggers a trace from the drop-down list.
Resource type
Select the type of the resource involved in a trace from the drop-down list.
For details about the resource types of each cloud service, see section "Supported Services and Operations" in the Cloud Trace Service User Guide.
Search By
Select one of the following options:
- Resource ID: ID of the cloud resource involved in a trace.
Leave this field empty if the resource has no resource ID or if resource creation failed.
- Trace name: name of a trace.
For details about the operations that can be audited for each cloud service, see section "Supported Services and Operations" in the Cloud Trace Service User Guide.
- Resource name: name of the cloud resource involved in a trace.
If the cloud resource involved in the trace does not have a resource name or the corresponding API operation does not involve the resource name parameter, leave this field empty.
Operator
User who triggers a trace.
Select one or more operators from the drop-down list.
If the value of trace_type in a trace is SystemAction, the operation is triggered by the service and the trace's operator may be empty.
Trace Status
Select one of the following options:
- Normal: The operation succeeded.
- Warning: The operation failed.
- Incident: The operation caused a fault that is more serious than a normal failure, for example, causing other faults.
- Click Query.
- On the Trace List page, you can also export and refresh the trace list.
- Click Export to export all traces in the query result as a CSV file. The file can contain up to 5,000 records.
- Click
 to view the latest information about traces.
- Click
 on the left of a trace to expand its details.

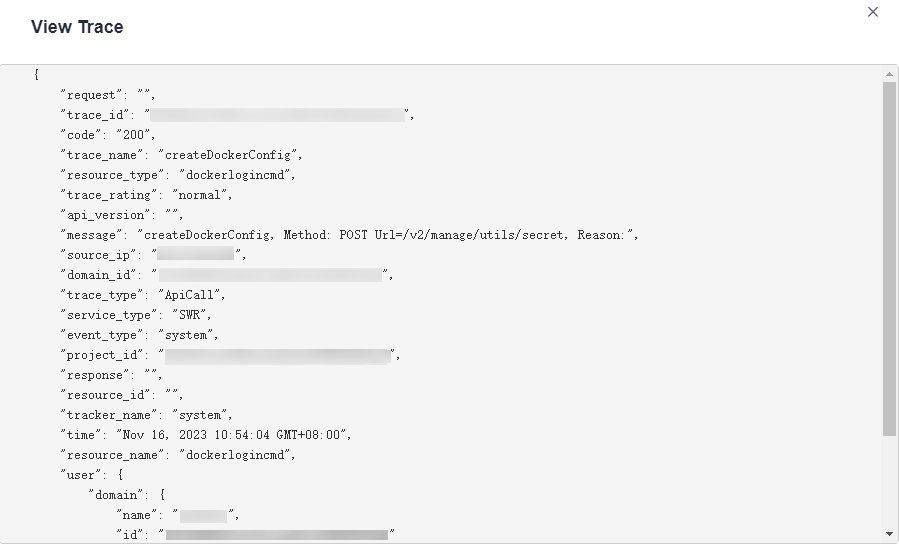
- Click View Trace in the Operation column. The trace details are displayed.

Helpful Links
- For details about the key fields in the trace structure, see section "Trace References" > "Trace Structure" in the Cloud Trace Service User Guide and section "Trace References" > "Example Traces" in the Cloud Trace Service User Guide.
Feedback
Was this page helpful?
Provide feedbackThank you very much for your feedback. We will continue working to improve the documentation.See the reply and handling status in My Cloud VOC.
For any further questions, feel free to contact us through the chatbot.
Chatbot


