Interconnecting with the Grafana Plug-in (Windows)
Grafana is a cross-platform open-source measurement analysis and visualization tool. It can query collected data, display the data in a visualized manner, and notify users in a timely manner.
LTS-Grafana is a plug-in of Grafana. It can analyze and display LTS data in a visualized manner.
Prerequisites
- You have installed Grafana.
- The Grafana version must be 9.0.0 or later.
- In Windows, you are advised to install Grafana on a non-system disk. Otherwise, you may not have the permission to open the Grafana configuration file.
- After Grafana is installed, enter localhost:3000 in the address box of the browser. The initial account and password are both admin.
- Download the LTS-Grafana plug-in package.
- The LTS-Grafana plug-in can be used only after the visualization function is enabled on the LTS console. For details, see Log Visualization.
Installing the LTS-Grafana Plug-in
- Install the LTS-Grafana plug-in.
- Go to the Grafana installation directory, for example, GrafanaLabs\grafana\data\plugins.
- Decompress the downloaded LTS-Grafana plug-in package to the current location. In this way, the file lts-grafana-plugin can be extracted.
- Copy the file lts-grafana-plugin to the GrafanaLabs\grafana\plugins-bundled\internal\input-datasource directory.
- Restart the Grafana service.
In Task Manager, choose Services, right-click Grafana, and choose Restart from the shortcut menu to restart the Grafana service.
- Modify the Grafana configuration file.
- Open the defaults.ini configuration file.
File path: Installation directory\GrafanaLabs\grafana\conf\defaults.ini
- Configure allow_loading_unsigned_plugins.
allow_loading_unsigned_plugins = hw-hws-lts-grafana-datasource-plugin
- Restart the Grafana service.
- Open the defaults.ini configuration file.
Adding a Data Source
- Enter localhost:3000 in the address box of the browser to log in to the Grafana service. The initial account and password are both admin.
- In the navigation pane on the left, click
 and choose Data sources. On the Data sources page that is displayed, click Add data source.
- Configure the data source.
Table 1 Parameters Parameter
Description
Example Value
Name
Plug-in name, which can be customized.
hws-lts-grafana-datasource-plugin
Endpoint
Select an endpoint based on your region. For details, see Regions and Endpoints.
-
projectId
Project ID of an account.
Log in to the LTS console, move the cursor to the account name and choose My Credentials > API Credentials. On the API Credentials page, copy the project ID of the region.
-
Log StreamId
ID of the log stream with structuring configured.
Log in to the LTS console and choose Log Management. Click
 of the target log group and hover your cursor over the target log stream to copy its ID.
-
AccesskeyId/SecretAccessKey
User access credential. Log in to the LTS console, move the cursor to the account name and choose My Credentials > Access Keys. On the Access Keys page, copy the access key ID.
-

- Click Save & test.
Adding a Dashboard
- In the navigation pane on the left, click
 and choose Dashboards. On the New dashboard page, click add an empty panel.
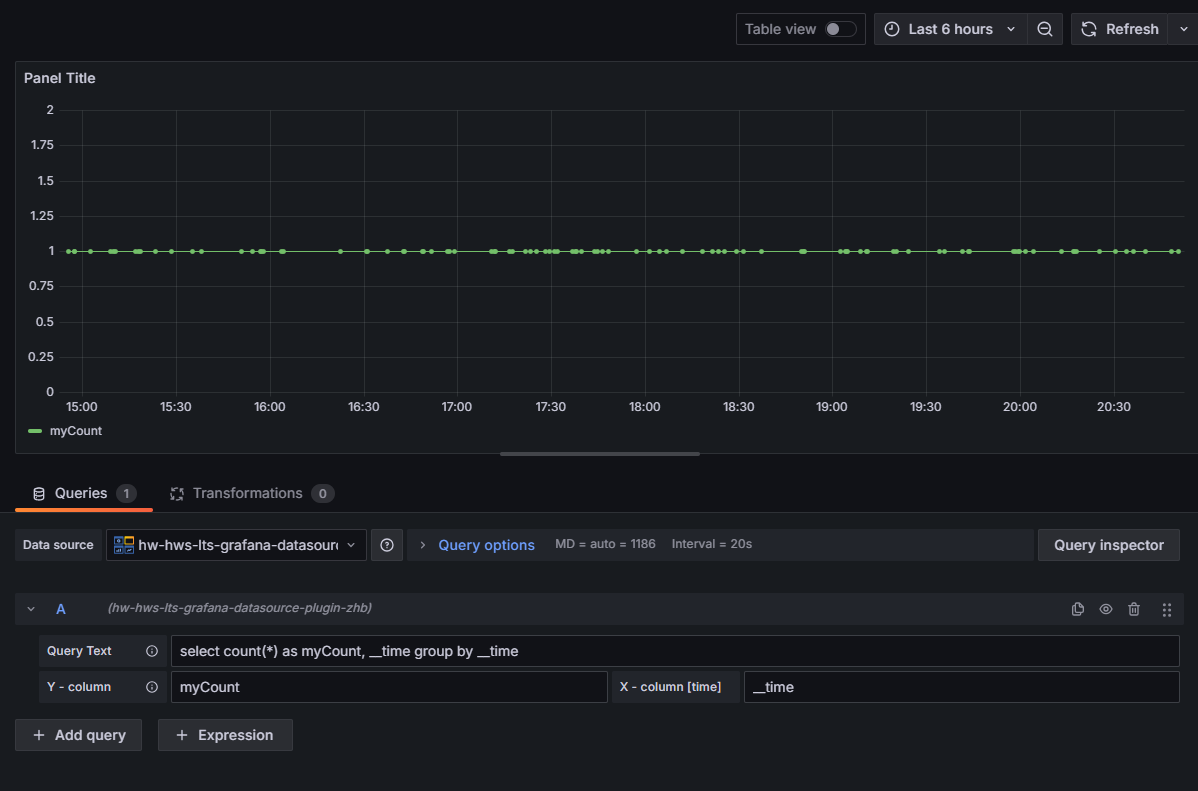
 - On the New dashboards page, select hws-lts-grafana-datasource-plugin and enter the corresponding SQL statement.
- Select the corresponding time in the upper right corner and click
 to refresh and display the latest data.
Follow the following rules when configuring parameters of the LTS-Grafana plug-in:
- For table data, set the x-column parameter to table.
- For single-value data, set the x-column parameter to single.
- For charts that contain dimension columns, set the x-column parameter to the time column field and y-column to col1:col2. col1 indicates the aggregation column, and col2 indicates the data column.
- For bar charts, set the x-column parameter to bar and y-column to col1,col2. col1 indicates the category column, and col2 indicates the data column.
- For pie charts, set the x-column parameter to pie and y-column to col1,col2. col1 indicates the category column, and col2 indicates the data column.
Feedback
Was this page helpful?
Provide feedbackThank you very much for your feedback. We will continue working to improve the documentation.See the reply and handling status in My Cloud VOC.
For any further questions, feel free to contact us through the chatbot.
Chatbot


