How Can I Locate the Cause If Java Container Memory Remains High and Even Triggers an OOM Error?
Background of the Java Process Memory
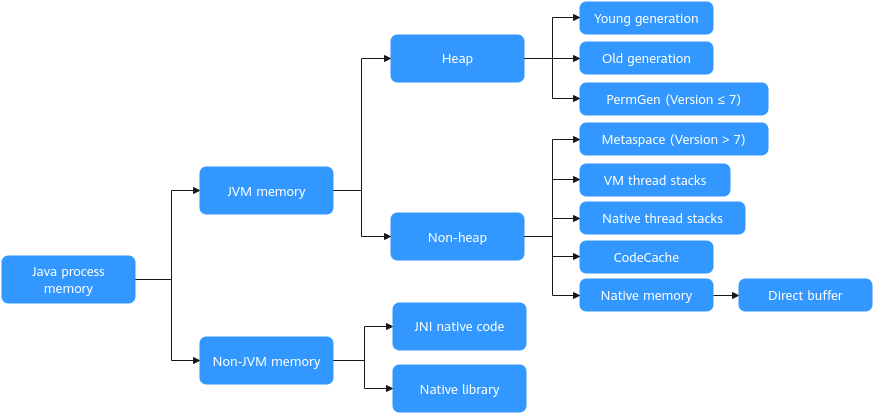
The Java heap memory is the primary memory area managed by the Java Virtual Machine (JVM). However, the heap memory limit defined by the -Xmx option cannot be used as the process memory limit. If the container memory limit is set to the same value as -Xmx, an OOM error may occur. In addition to heap memory, the JVM manages other types of memory. The following figure presents the memory usage of a Java process.

The Java process memory includes JVM memory and non-JVM memory.
- JVM memory is managed by the JVM and can be further divided into heap memory and non-heap memory.
- The heap is the largest memory area and is where OOM errors occur most frequently. Shared by all threads, it stores nearly all instance objects and arrays, which must be allocated on the heap. The heap is also the main area managed by the garbage collector, often referred to as the garbage collection (GC) heap. The Java heap is divided into the young generation and the old generation. This division is based on the generational garbage collection algorithm.
- Non-heap memory stores class metadata and thread information and is not used for object instances.
- Metaspace was introduced in Java 8 as a replacement for Permanent Generation (PermGen). It serves as the implementation of the method area defined by the JVM specifications. Unlike PermGen, Metaspace uses local memory instead of being part of the JVM memory, and its size is limited only by the amount of available local memory.
- For VM thread stacks, each thread has a private stack created by the JVM. Java methods are called and executed through these stacks, except for local methods.
- Native thread stacks are similar in function to the VM thread stacks. The VM thread stacks execute Java methods (like bytecode) for virtual machines, while the native thread stacks execute native (local) methods used by the virtual machines.
- CodeCache stores JVM bytecode as native code. If this area runs out of memory, the error java.lang.OutOfMemoryErrorcode cache will appear in the logs.
- Native memory refers to memory outside the JVM heap, often called off-heap memory. Despite being outside the JVM heap, native memory is still part of the Java program's process memory. Crucially, native memory cannot be managed by the JVM. Native memory includes memory consumed by assembly, C, or C++ code when invoked by Java programs.
- Non-JVM memory encompasses all memory outside of the JVM's control, such as memory used by local or Java Native Interface (JNI) libraries.

When running Java processes in containers, the -Xmx or --XX:MaxRAMPercentage options limit only the heap memory, not the entire Java process memory. For example, if --XX:MaxRAMPercentage=70% is configured, the maximum heap memory will be restricted to 70% of the total memory. However, non-heap memory also consumes container memory, which may cause the total memory usage of the Java process to exceed the expected limit.
Container Memory Metrics
When deploying Java services on VMs, users often overlook the overall memory usage of these services because the entire VM is typically dedicated to the Java services. However, when containerization is adopted to improve scheduling density and optimize overall resource utilization, users frequently configure a memory limit to define the upper memory threshold for a single container. This limit is enforced using the kernel cgroups. Memory, being an incompressible resource, triggers the OOM error if the memory usage exceeds the specified limit. When this occurs, the OS terminates the container and restarts it. As a result, it is crucial to monitor container memory usage after service containerization.
- In this context, the OS uses the memory_limit_in_bytes parameter to determine the maximum memory a cgroup can use. If the total memory usage of a cgroup (memory_usage_in_bytes) approaches the memory_limit_in_bytes value, the OS attempts to reclaim memory. If enough memory is successfully reclaimed such that the usage stays within the limit, OOM is not triggered. Otherwise, the OOM mechanism is activated. The memory usage is calculated as follows:
memory_usage_in_bytes = Anonymous memory (inactive_anon and active_anon) + File memory (inactive_file and active_file)
- active_anon: bytes in the anonymous and swap caches in the active Least Recently Used (LRU) list, including tmpfs
- inactive_anon: bytes in the anonymous and swap caches in the inactive LRU list, including tmpfs
- active_file: file-backed memory bytes supported by files in the active LRU list
- inactive_file: file-backed memory bytes supported by files in the inactive LRU list
Kubernetes does not support the swap memory function in containers. As a result, anonymous memory in container services cannot be reclaimed. In contrast, file memory, which includes memory mapping files (mmap), file read/write caches, binaries, and dynamic link libraries, can be reclaimed. When memory reclamation is triggered, the system prioritizes reclaiming memory associated with inactive_file by writing its content back to the disk. The memory in active_file, being recently accessed, is generally preserved and reclaimed only as a last resort.
- In cloud native monitoring, the working set metric is used to measure container memory usage. It is calculated as follows:
Working set memory = Anonymous memory (inactive_anon and active_anon) + active_file
Troubleshooting High Memory Usage of a Java Container
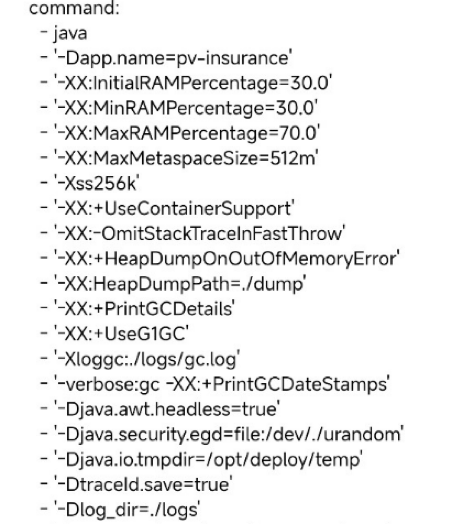
The following configuration example helps in analyzing the memory usage of a Java process in a container.

In the example, key parameters include:
- -XX:MaxRAMPercentage=70.0: limits the maximum heap memory to 70% of the container memory.
- -XX:MaxMetaspaceSize=512m: sets the threshold for triggering full garbage collection (FGC) at 512 MiB.
- -Xss256k: allocates 256 KB of memory per thread.
- -XX:+UseG1GC: specifies G1 GC as the collector.
In this example, the container memory limit is set to 6 GiB. If the actual container memory usage is high, take the following steps:
- Check working set memory usage and determine if either the working set memory or the actual memory usage of the container is unusually high.
To view memory statistics, log in to the target container and run the following command:
cat /sys/fs/cgroup/memory/memory.stat
Key metrics to analyze include total_cache (cache memory), total_rss (memory consumed by the current application process), and total_inactive_file (memory associated with inactive files).
The working set memory is calculated as Working set memory = total_cache + total_rss – total_inactive_file
Assume that the content of the memory.stat file is as follows:
rss 1048576
cache 524288
inactive_file 262144
The working set memory is:
WorkingSet = 1048576 + (524288 - 262144) = 1310720 bytes
The standard cloud native monitoring measures working set memory to evaluate container memory usage. When the container memory usage is high, you can check the working set and anonymous memory usage of the container. If the active_file memory usage is excessive, you need to investigate whether the application frequently reads/writes files, processes large files, or uses memory mapping (mmap) as indicated in Container Memory Metrics.
If the working set memory is close to anonymous memory, you can analyze the JVM memory composition, GC, or other factors to identify the impact.
- Analyze the memory allocation and GC behavior of a Java service.
- Access the service container and verify the maximum Java heap memory.
Use the -XshowSettings:vm -version option to check JVM settings and ensure the maximum heap memory aligns with the expected value.
In this example, the container memory limit is 6 GiB, and the Java startup parameter is -XX:MaxRAMPercentage=70%. Therefore, the maximum heap memory is 4.2 GiB, which meets the expectation.
- Analyze and view GC logs with the startup parameter -Xloggc:…/logs/gc.log. GC logs help determine whether JVM memory reclamation meets expectations, such as monitoring full GC occurrences.
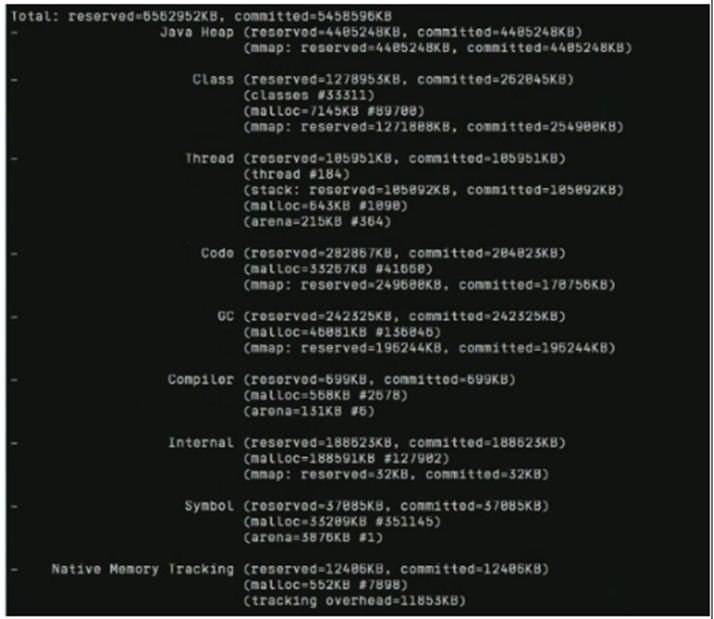
- Use Native Memory Tracking (NMT) to analyze JVM memory usage.
- Add -XX:NativeMemoryTracking=detail to the Java process startup parameters.
# Enable NMT when Java is started. By default, NMT is disabled. Do not enable this function for a long time in a production environment. Otherwise, performance may be affected.
java -XX:NativeMemoryTracking=detail -jar
- Run the jcmd pid VM.native_memory summary command to view the memory allocation information. (In the command, pid indicates the process ID.)
# View details.
jcmd pid VM.native_memory summary
Memory items occupied by Java processes include Java Heap, Class, Thread, and Code. For example, the total committed memory may be 5.2 GiB, with the Java heap committed consuming 4.2 GiB. High pod memory usage often correlates with Java heap memory consumption.
- Add -XX:NativeMemoryTracking=detail to the Java process startup parameters.
- Analyze the heap dump.
Obtain the heap memory dump using jmap and evaluate whether the data meets expectations.
Run the jmap -dump:format=b,file=/xxx/dump.hprof pid command. If you want to trigger GC, add the live parameter to it, for example, jmap -dump:live,format=b,file=dump.hprof pid.
By analyzing the generated dump bin file, you can identify memory data that is not reclaimed by the GC, including large objects and arrays retrieved during database queries. This data primarily consists of heap memory. If full GC is not triggered, memory reclamation will not occur. To address this issue, optimize SQL statements by avoiding unnecessary field queries.
- Access the service container and verify the maximum Java heap memory.
Based on the preceding analysis and large-scale test results, the following conclusions can be drawn:
- During the Java service pressure tests, the -XX:MaxRAMPercentage parameter is set to 70%, and the heap memory upper limit is set to about 4 GiB. Under these conditions, the pressure tests run smoothly. The heap memory effectively stores database query results and is automatically reclaimed by the JVM as needed.
- The non-heap memory was approximately 1 GiB during testing.
- The high memory usage observed during monitoring can be attributed to the configuration where -XX:MaxRAMPercentage is set to 70% and the container memory limit is configured at 6 GiB. Under these conditions, the total Java memory consumption amounts to approximately 5.2 GiB, which includes 4.2-GiB heap memory and 1-GiB non-heap memory. This results in a memory usage of approximately 87% (5.2 GiB/6 GiB).
Troubleshooting
Adjust the value of -XX:MaxRAMPercentage from 70.0% to 50.0%. Additionally, increase the value of memory.Limits from 6 GiB to 8 GiB. These adjustments ensure that the heap memory satisfies the maximum requirements while reserving enough space for non-heap memory.
Appendix: JVM Parameter Configuration
The Java process can use stack memory through certain startup parameters. Below is the details of common parameters in JDK 8 and later versions.
Java Stack Memory Parameters
The Java heap memory is the largest part of memory managed by the JVM. It is a memory area shared by all threads and created when the JVM starts. The sole purpose of the Java heap memory is to store object instances, with almost all object instances and arrays allocated memory here.
- -Xms: sets the minimum heap memory and initializes the heap memory size. The unit can be k/K, m/M, or g/G, with a minimum value of 1 MiB. For example: -Xms6m.
- -Xmx: sets the maximum heap memory. It is advised to set this equal to -Xms to prevent dynamic resizing.
- -Xmn: sets the maximum size of young generation memory and its initial size. It is advised to allocate 1/2 to 1/4 of the heap size to this area. If it is too small, minor GCs occur frequently; if too large, only full GC is triggered, which takes longer. For example, -Xmn2G.
- -XX:NewSize: sets the initial size of the young generation memory.
- -XX:MaxNewSize: sets the maximum size of the young generation memory.
- -XX:MetaspaceSize: specifies the metaspace size, which uses local memory. If usage exceeds this size, FGC will be triggered. This defines the threshold for GC.
- -XX:MaxMetaspaceSize: sets the maximum metaspace size, which uses local memory. For example, -XX:MaxMetaspaceSize=256m.
- -Xss: defines the size of each thread stack. The default value on the Linux/x64 platform is 1024 KB. For example, -Xss1024k.
GC Parameters
These parameters control the garbage collection strategy employed by the JVM.
- -XX:+UseG1GC: enables the G1 garbage collector, which is recommended for applications with heap sizes exceeding 6 GiB and low-latency requirements.
- -XX:+PrintGCDetails: prints detailed information about garbage collection whenever it occurs. This parameter is disabled by default.
- -XX:+PrintGCDateStamps: includes a date and timestamp with each GC event.
- -Xloggc:gc.log: specifies the output path for GC log files.
OOM Parameters
- -XX:+HeapDumpOnOutOfMemoryError: dumps the heap to a physical file when the java.lang.OutOfMemoryError exception is thrown.
- -XX:HeapDumpPath=/var/log/xxx/xx.hprof: specifies the path for the heap dump file in .hprof format.
Parameters for Container Scenarios
In containerized environments, resource allocation is dynamic, making manual adjustments to heap memory limits cumbersome. JVM parameters allow for dynamic adjustment using the following parameters:
- -XX:+UseContainerSupport: enables container support by default. The JVM automatically detects the container platform to determine available memory and CPUs for the Java process.
- -XX:MaxRAMPercentage=xxx: sets the maximum percentage of Java heap memory. For example, with -XX:MaxRAMPercentage=50, the Java heap memory is capped at 50% of the container's available memory. This parameter is used to dynamically adjust the maximum heap memory size in container scenarios. It is equivalent to the -Xmx parameter.
- -XX:MinRAMPercentage=xxx: sets the minimum percentage of Java heap memory. This parameter ensures that a minimum heap memory is allocated when the container memory limits are low. For a container memory limit of 250 MiB or less, this parameter is used to calculate maximum heap memory dynamically.
Feedback
Was this page helpful?
Provide feedbackThank you very much for your feedback. We will continue working to improve the documentation.See the reply and handling status in My Cloud VOC.
For any further questions, feel free to contact us through the chatbot.
Chatbot


