Using Multi-Chart Query Results for Alarm Detection and Notification
When configuring alarm rules, you may need to use the query results of multiple charts. You can use the query result of the first chart to detect alarms and include the query results of other charts in alarm notifications.
For example, you want to monitor ERROR logs and trigger a critical alarm if 10 logs whose level is ERROR are generated within 5 minutes. The alarm notification email will then include the query result of error logs, including parameters level (log level), num (log number), and message (error information).
To do this, you would add two charts to your alarm rule.
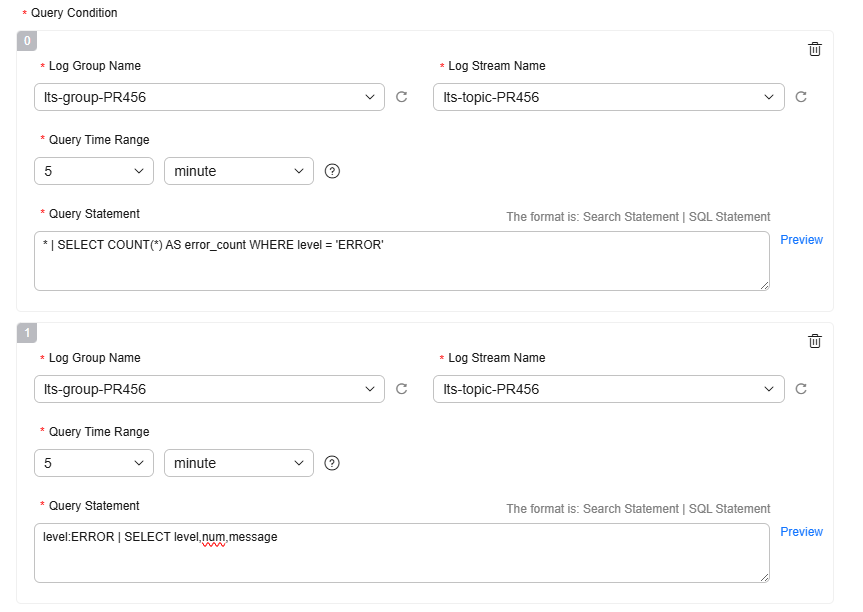
- First chart (numbered 0): queries the number of logs whose level is ERROR. Its result is used to define the check rule's condition expression.
- Second chart (numbered 1): queries error log details, including level, num, and message. These results will be included in the alarm notification email body.
You can follow the following steps to configure an alarm rule for this scenario.
Video Tutorial
Creating a Message Template
A message template provides a fixed format for your alarm notifications. When an alarm is triggered, the system automatically populates the template's variables with content from your alarm rules. For example, to include the query result of error logs in your email notifications, add the following statement to Body of your message template:
Query log: $event.annotations.results[1].raw_results
- Log in to the LTS console.
- Choose Log Alarms in the navigation pane.
- Click Alarm Notification Rules.
- Click the Message Templates tab and click Create. The Create Message Template right pane is displayed.
- Set parameters by referring to Table 1.
Figure 2 Message template
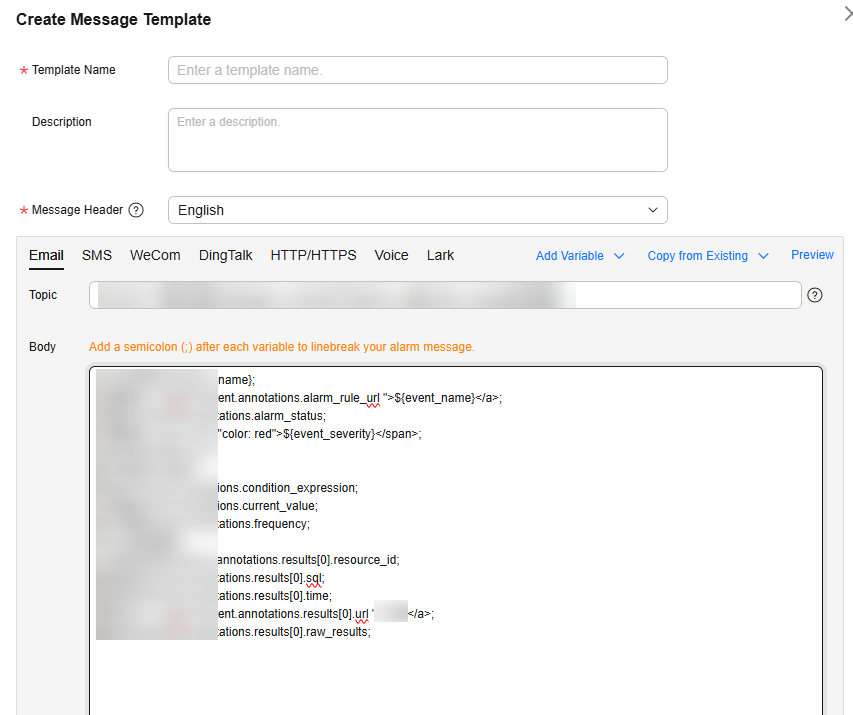
Table 1 Parameters for creating a message template Parameter
Example Value
Description
Template Name
multi_table_query
Message template name.
Use only digits, letters, underscores (_), and hyphens (-). Do not start or end with an underscore or hyphen. Enter up to 100 characters.
Description
-
Description of a message template.
Use only digits, letters, and underscores (_). Do not start or end with an underscore. Enter up to 1,024 characters.
Message Header
Chinese (Simplified)
A header (for example, "Dear customer") will be added to each message by default.
Notification method
Email
Notification method.
Topic
Huawei Cloud LTS Notification: [${region_name}] and ${starts_at} O&M Notification
Email subject. You can specify a subject or use variables.
A subject can contain a maximum of 512 characters.
Variables:
- Occurrence region: ${region_name}
- Occurrence time: ${starts_at}
Body
Huawei Cloud account: ${domain_name};
Alarm rule: <a href="$event.annotations.alarm_rule_url ">${event_name}</a>;
Alarm status: $event.annotations.alarm_status;
Alarm severity: ${event_severity};
Occurrence time: ${starts_at};
Expression: $event.annotations.condition_expression;
Current value: $event.annotations.current_value;
Statistical period: $event.annotations.frequency;
Log group/stream name: $event.annotations.results[1].resource_id;
Query statement: $event.annotations.results[1].sql;
Query URL: <a href="$event.annotations.results[1].url ">Details</a>;
Query log: $event.annotations.results[1].raw_results;
You can insert variables into your email body.
Variables:
- Huawei Cloud account: ${domain_name}
- Alarm rule details link: $event.annotations.alarm_rule_url
- Original alarm rule name: ${event_name}
- Alarm severity: ${event_severity}
- Occurrence time: ${starts_at}
- Alarm rule triggering condition expression: $event.annotations.condition_expression
- Current value of the condition expression: $event.annotations.current_value
- Statistical period: $event.annotations.frequency
- To include the log group/stream name from the second chart (chart 1) for querying error log details: $event.annotations.results[1].resource_id
- To include the query URL from the second chart (chart 1) for querying error log details, use this variable: $event.annotations.results[1].url. Clicking the details link in the email will redirect you to the specific log stream details page.
- To include the query log result from the second chart (chart 1) for querying error log details: $event.annotations.results[1].raw_results
- Click OK.
Creating an Alarm Notification Rule
Alarm notification rules link SMN topics with message templates. When an alarm is triggered, the system automatically sends an email notification using the specified message template.
- Log in to the LTS console.
- Choose Log Alarms in the navigation pane.
- Click Alarm Notification Rules.
- On the Alarm Notification Rules tab page, click Create. Set parameters by referring to Table 2.
Figure 3 Alarm notification rule
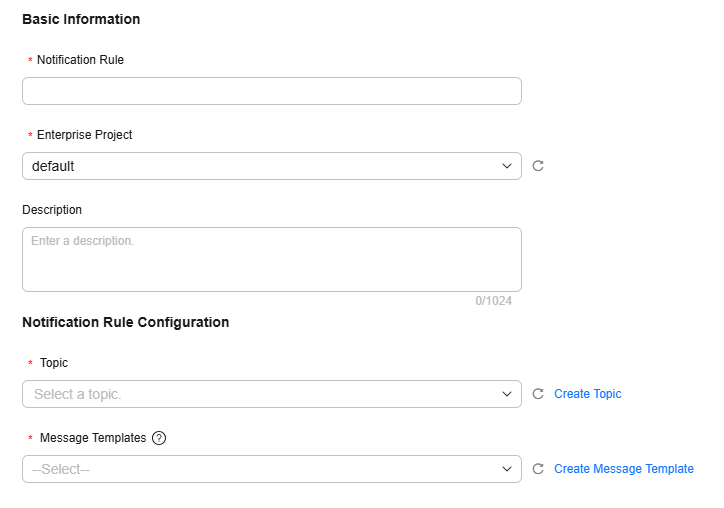
Table 2 Alarm notification rule parameters Parameter
Example Value
Description
Notification Rule
error_log_email_notification
Notification rule name, which cannot be changed after the rule is created. Naming rules:
Enter 1 to 64 characters. Only digits, letters, underscores (_), and hyphens (-) are allowed. Do not start or end with an underscore or hyphen.
Enterprise Project
default
Select an enterprise project.
This parameter is displayed only when the enterprise project function is enabled for the current account.
Description
-
Enter a description for the rule. Up to 1,024 characters are allowed.
Topic
LTS
Select an SMN topic.
You can click Create Topic to access the SMN console, create a topic named LTS, and add a subscription (recipient email addresses) for it.
For details about how to create a topic, see Creating a Topic.
For details about how to subscribe to a topic, see Adding a Subscription to a Topic.
Message Templates
multi_table_query
Select a message template from the drop-down list.
- Click OK.
Creating an Alarm Rule
An alarm rule defines the conditions that trigger alarms, including the query condition, check rule, query frequency, notification frequency, and notification channel.
- Log in to the LTS console.
- Choose Log Alarms in the navigation pane.
- Click the Alarm Rules tab.
- Click Create.
- On the displayed Create Alarm Rule right panel, set parameters as follows:
- Configure the Basic Info parameters.
Figure 4 Basic Info
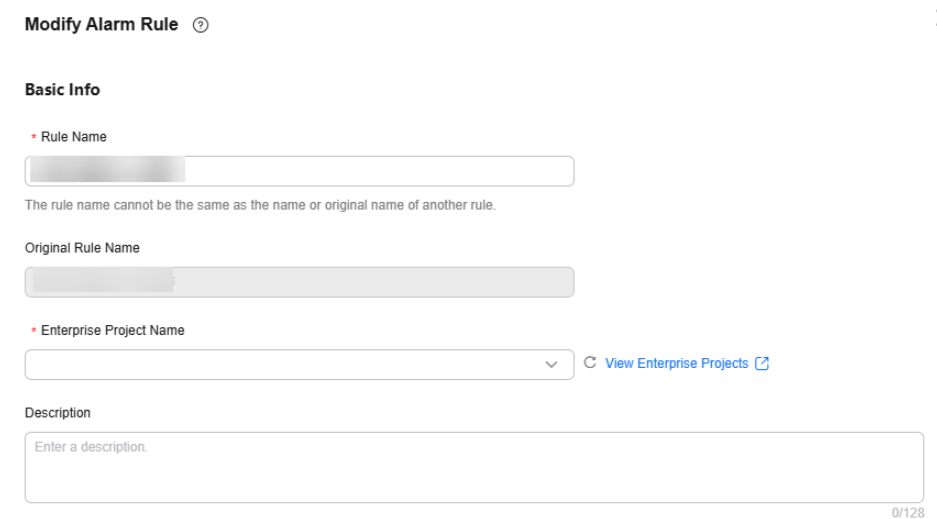
Table 3 Basic information about search analysis alarms Parameter
Example Value
Description
Rule Name
error_log_alarm
Define a name for your alarm rule based on service requirements. After the rule is created, move the cursor to the rule name in the rule list to view both the rule name and the original rule name. You can modify the rule name, but cannot modify the original rule name (defined during rule creation).
Naming rules:
Use only letters, digits, hyphens (-), and underscores (_). Do not start or end with a hyphen or underscore. Enter 1 to 128 characters.
Enterprise Project Name
default
Select the required enterprise project. The default value is default.
Description
Reports an alarm and includes log details if more than 10 ERROR logs are generated within 5 minutes.
Brief description of the rule. Enter up to 128 characters.
- Configure the Statistical Analysis parameters.
Figure 5 Statistical analysis
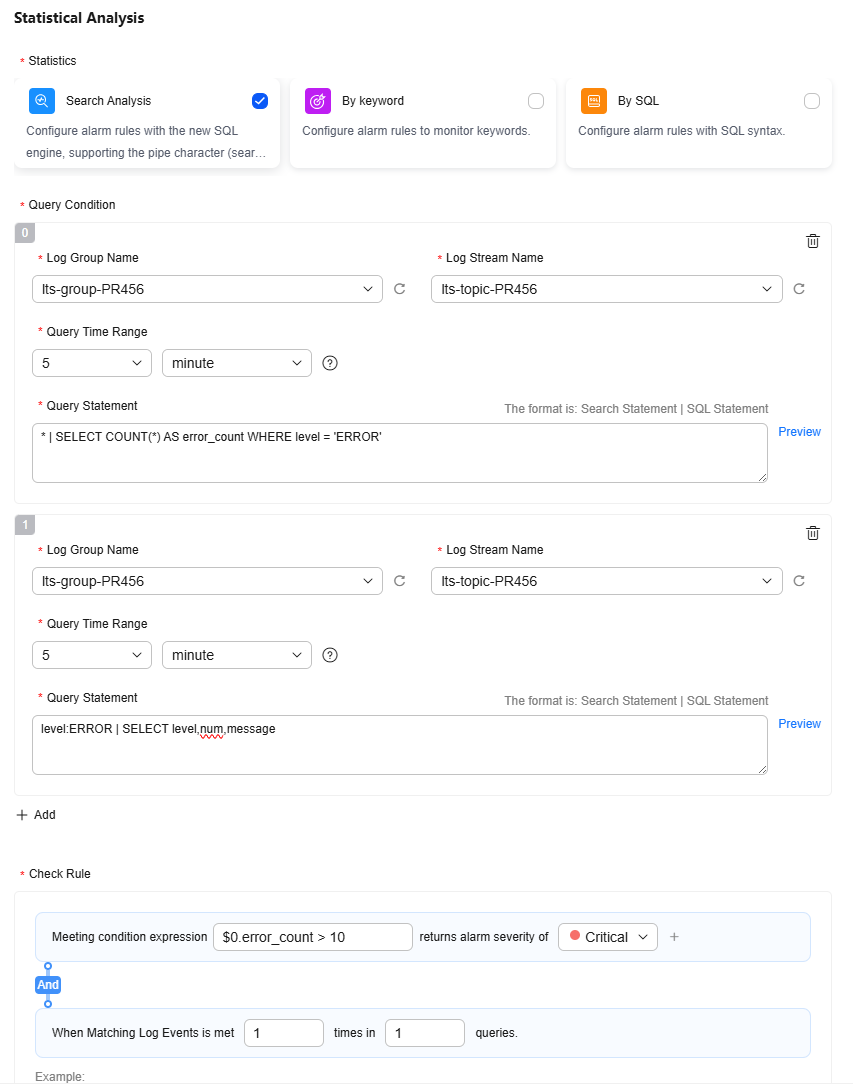
Table 4 Alarm rules based on Search | Analysis statistics Parameter
Example Value
Description
Query Condition (query charts)
Add the first chart (chart 0), which is used for alarm detection rules.
lts-group-PR456
Log Group: Select the created log group lts-group-PR456.
lts-topic-PR456
Log Stream: Select the created log stream lts-topic-PR456.
5 minutes
Query Time Range: Specify the query period of the statement. It is one period earlier than the current time. For example, if Query Time Range is set to 5 minutes and the current time is 9:00, the query statement period is 8:55–9:00.
* | SELECT COUNT(*) AS error_count WHERE level = 'ERROR'
Query Statement: Enter a statement in the following format.
Search statement | SQL analysis statement
LTS monitors logs in the log stream based on the configured statement. Enter a query statement and click Preview to see the query result.
Click Add to add a chart (chart 1), which is used to display log content. The log group, log stream, and query time range should be the same as the previous chart. Set the query statement to:
level:ERROR | SELECT level,num,message
Check Rule
$0.error_count > 10
Enter a specific condition expression. When the expression execution result is true, an alarm is generated.
When a condition expression is associated with multiple charts, the following format must be used to reference fields in the condition expression:
${Query condition No.}.{Query statement field}$0.error_count indicates the error_count field in the query statement * | SELECT COUNT(*) AS error_count WHERE level = 'ERROR' of the first chart (chart 0).
The second chart (chart 1) is used to query the level, num, and message fields of error logs. It is not used for the alarm verification rule. The corresponding variables have been added to the body as instructed in Creating a Message Template.
CAUTION:When multiple charts are used, the condition expression must contain the first chart (chart 0), that is, $0. Therefore, the sequence of the two charts in this example cannot be changed.
- Configure the Advanced Settings parameters.
Figure 6 Advanced Settings
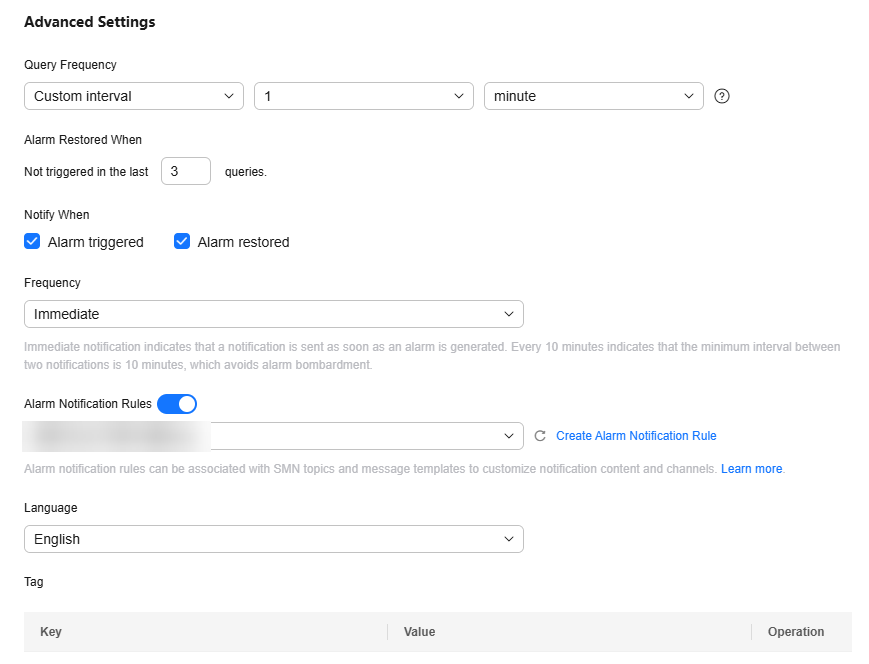
Table 5 Parameters of a search analysis alarm rule Parameter
Example Value
Description
Query Frequency
Custom interval: 1 minute
If you set the query frequency of a condition expression to Custom interval, you can specify the interval from 1 minute to 60 minutes or from 1 hour to 24 hours. For example, if the current time is 9:00 and the Custom interval is set to 5 minutes, the first query is at 9:00, the second query is at 9:05, the third query is at 9:10, and so on.
Alarm Restored When
3
If alarm restoration notification is enabled and the trigger condition has not been met for the specified number of last queries, an alarm restoration notification is sent.
Number of last queries: 1–10
Notify When
Select Alarm triggered and Alarm restored.
- Alarm triggered: Specify whether to send a notification when an alarm is triggered. If this option is enabled, a notification will be sent when the trigger condition is met. If disabled, no notifications will be sent, even if the trigger condition is met.
- Alarm restored: Specify whether to send a notification when an alarm is restored. If this option is enabled, a notification will be sent when the restoration policy is met. If disabled, no notifications will be sent, even if the restoration policy is met.
Frequency
Immediate
Notification is sent as soon as an alarm is generated.
Alarm Notification Rules
error_log_email_notification
Select the created alarm notification rule error_log_email_notification from the drop-down list.
Language
Chinese (Simplified)
Specify the language (Chinese (simplified) or English) in which alarms are sent.
Tag
-
Tag alarm rules as required. Click Add and enter a tag key and value.
- Configure the Basic Info parameters.
- Click OK.
Viewing Alarm Notifications
Logs are reported to LTS. When 10 error logs are generated within 5 minutes, you will receive an email notification. The email body contains the error log statistics of the first chart (chart 0) and the error log details of the second chart (chart 1).
Feedback
Was this page helpful?
Provide feedbackThank you very much for your feedback. We will continue working to improve the documentation.See the reply and handling status in My Cloud VOC.
For any further questions, feel free to contact us through the chatbot.
Chatbot


