
Using Kibana Discover for Time Series Data Visualization
On Kibana Discover, you can create index patterns to define which Elasticsearch indexes to explore, and visualize and query time-series data using specified time fields.
Scenario
- Log analytics: Filter server logs by time to identify and diagnose abnormal events.
- Service monitoring: Monitor real-time changes and trends in key metrics, such as order volume and user activity.
- Data insights: Quickly browse data and verify data ingestion results.
Solution Architecture
Discover serves as Kibana's primary interface for interactive data exploration. It directly interacts with the underlying Elasticsearch cluster.
- User requests: Users set filters, rank data, and select time ranges on the Discover page.
- Kibana: Converts user requests into Elasticsearch query DSL.
- Elasticsearch: Executes queries and returns the results.
- Kibana: Visualizes the results using charts and tables (for example, showing document counts using a horizontal bar chart).
For more information, see Discover.
Highlights
- Easy to use: An intuitive GUI enables quick data query and browsing without complex settings.
- Flexible: Kibana's intuitive KQL (Kibana Query Language) syntax and flexible filters enable precise, real-time data discovery across your Elasticsearch indexes.
- Real-time: Data is updated in real time. You can set time fields to query the latest data.
Prerequisites
- A CSS Elasticsearch cluster has been created. For a security-mode cluster, make sure its username and password have been obtained.
- The target data for query or analytics (such as logs and monitoring metrics) has been ingested into your Elasticsearch cluster. The data must contain a time field (for example, @timestamp).
Procedure
This section uses Kibana 7.10.2 as an example to describe how to use Discover for time-series data visualization. The Kibana UI varies slightly depending on the Kibana version.
- Log in to Kibana and go to the command execution page.
- Log in to the CSS management console.
- In the navigation pane on the left, choose Clusters > Elasticsearch.
- In the cluster list, find the target cluster, and click Kibana in the Operation column to log in to the Kibana console.
- In the left navigation pane, choose Dev Tools.
The left part of the console is the command input box, and the triangle icon in its upper-right corner is the execution button. The right part shows the execution result.
- Create an index pattern.
- On the Kibana console, click the menu icon in the upper-left corner and choose Management > Stack Management.
- On the Stack Management page, choose Index Patterns and click Create index pattern.
- In the Index pattern name text box, enter an index name prefix (for example, kibana_sample_data*).
- Click Next step.
- Select a time field (for example, @timestamp) from the Time field drop-down list.
- Click Create index pattern to create an index pattern. Figure 1 Creating an index pattern

- Go to the Discover page.
- On the Kibana console, click the menu icon in the upper-left corner, and choose Kibana > Discover.
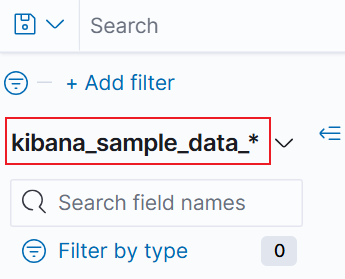
- Select the index pattern created in the previous step (for example, kibana_sample_data*) from the Index patterns drop-down list. Figure 2 Selecting an index pattern
- Browse data.
- Bar chart: shows document counts in chronological order (aggregated every 15 minutes by default).
- Document list: shows 500 matching documents by default (you can scroll down to load more).
Figure 3 Browsing data
- Search for data.
- Add filters: In the Add filter area, select a field and enter a value (for example, response.keyword: 200) to filter the data.
- Use KQL to query data: Enter a Kuery query statement (for example, request.keyword: "/elasticsearch") in the search box and press Enter. For more information, see Kibana Query Language.
Figure 4 Searching for data
- Set a time filter.
- Adjust the time range. Click the time filter in the upper-right corner and select one of the following:
- Absolute: Specify the start time and end time (for example, from 2024-03-01 00:00 to 2024-03-02 00:00).
- Relative: Set an offset from the current time (for example, Last 1 hour or Last 7 days).
- Now: Always update to the latest refresh time.
Figure 5 Time filter
- Perform an interactive query on a histogram. Click a time range in the bar chart to quickly locate documents that fall into this range.
- Adjust the time range. Click the time filter in the upper-right corner and select one of the following:
Feedback
Was this page helpful?
Provide feedbackThank you very much for your feedback. We will continue working to improve the documentation.See the reply and handling status in My Cloud VOC.
For any further questions, feel free to contact us through the chatbot.
Chatbot


