Using Logstash to Sync Kafka Data to Elasticsearch
This topic describes how to use CSS Logstash to sync data from Kafka to CSS Elasticsearch. Logstash is an open-source data processing pipeline that ingests data from various sources, transforms it, and then sends it to your desired destination. A key component of the ELK Stack—Elasticsearch, Logstash, and Kibana—Logstash supports a multitude of data sources and ETL (Extract, Transform, and Load) methods, enabling efficient log management and services.
Scenarios
You may need to use CSS Logstash to sync data from Kafka to CSS Elasticsearch in the following scenarios:
- Real-time log management: real-time ingestion, processing, and storage of log data.
- Data preprocessing: cleaning, transformation, and enriching of raw log data.
- Unified log management: a unified log management platform for log storage, analysis, and visualization.
Solution Architecture

- Kafka as messaging middleware stores log data to be processed.
- Logstash consumes data from Kafka topics, performs ETL, and writes the processed data to Elasticsearch.
- Elasticsearch stores processed log data to support efficient query and analytics.
- Kibana provides data visualization, facilitating data analysis and reporting.
Advantages
- Efficient data processing: Logstash supports high throughput and low latency in data processing.
- Flexible configuration: A variety of data sources and destinations are supported.
- Horizontal scalability: The solution can be used for large-scale data processing.
- Real-time: Data is consumed from Kafka topics and ingested into Elasticsearch in real time.
Constraints
The networks between Logstash and Kafka and between Logstash and Elasticsearch must be connected.
Prerequisites
- An Elasticsearch cluster has been created on the CSS console for storing and analyzing data. The cluster status is Running. You have obtained and recorded the cluster address. In the case of a security-mode cluster, you have obtained the administrator account and password.
To create an Elasticsearch cluster, see Creating an Elasticsearch Cluster.
- A Logstash cluster has been created on the CSS console for data processing.
To create a Logstash cluster, see Creating a Logstash Cluster.
- Data has been ingested into the specified Kafka topics. You have obtained and recorded the IP address and port number of Kafka.
If Distributed Message Service (DMS) for Kafka is used, see Creating a Kafka Topic for how to create a Kafka topic.
Step 1: Create an Index Template in Elasticsearch
An index template is a way to tell Elasticsearch how to configure an index when it is created. It defines settings, mappings, and aliases that can be applied automatically to new indexes. The settings include the number of shards, number of replicas, and field types. Make sure they are consistent with how data is actually stored in Elasticsearch.
- Log in to the Kibana console of the destination cluster.
- Log in to the CSS management console.
- In the navigation pane on the left, choose Clusters > Elasticsearch.
- In the cluster list, find the target cluster, and click Kibana in the Operation column to log in to the Kibana console.
- In the left navigation pane, choose Dev Tools.
The left part of the console is the command input box, and the triangle icon in its upper-right corner is the execution button. The right part shows the execution result.
- Run the following command to create an index template.
For example, create an index template that specifies three shards and no replicas per index and defines the @timestamp field in indexes.
PUT _template/filebeat
{
  "index_patterns": ["*topic*"],
  "settings": {
    # Define the number of shards.
    "number_of_shards": 3,
    # Define the number of replicas.
    "number_of_replicas": 0,
    "refresh_interval": "5s"
  },
  # Define fields.
  "mappings": {
        "properties": {
          "@timestamp": {
            "type": "date"
          }
        }
    }
}
Step 2: Test the Network Connectivity Between Logstash and Kafka
Test the network connectivity between Logstash and Kafka, making sure data can be correctly transmitted from Kafka to Logstash and then ingested into Elasticsearch.
- Go to the Configuration Center page.
- Log in to the CSS management console.
- In the navigation pane on the left, choose Clusters > Logstash.
- In the cluster list, click the name of the target cluster. The cluster information page is displayed.
- Click the Configuration Center tab.
- On the Configuration Center page, click Test Connectivity.
- In the Test Connectivity dialog box, enter the IP address and port number of Kafka, and click Test. Figure 2 Testing connectivity

If Available is displayed, the network is connected.

- If Logstash and Kafka are on the same internal network but are not connected, connect them by referring to Configuring Routes for a Logstash Cluster.
- If Kafka is on an external network where it cannot be reached, connect them by referring to Configuring Public Network Access for a Logstash Cluster.
Step 3: Create a Logstash Configuration File
A Logstash configuration file defines the rules for data input, processing, and output, ensuring data can be correctly consumed from Kafka topics, processed, and ingested into Elasticsearch.
- On the Configuration Center page of the Logstash cluster, click Create in the upper right corner to edit the configuration file.
- Applying a cluster template: Expand the system template list, select kafka, and click Apply in the Operation column.
- Setting the configuration file name: Set Name, for example, kafka-es.
- Editing the configuration file: In Configuration File Content, set the parameters by referring to their comments. The following provides an example of the configuration file content. Modify the content as needed.
- Configure a single Logstash pipeline with multiple Kafka inputs (one per topic) rather than using a single input to consume all topics.
- For different Kafka topics, configure group_id, client_id, and type to ensure proper isolation between consumer groups.
- Configure consumer_threads based on the number of partitions in topics. The number of Logstash nodes multiplied by consumer_threads must be greater than or equal to the number of partitions.
- Logstash processes timestamps in UTC. To enable daily index rollover at 00:00 (UTC+8), modify the Ruby code to add 8 hours to the timestamps.
input { kafka { # Read data in JSON format. codec => "json" # Topic name topics => ["topic-nginx"] # Kafka IP address bootstrap_servers => "192.168.0.1:9092,192.168.0.2:9092" # Kafka heartbeat settings. Keep the default. max_poll_interval_ms => "3000000" session_timeout_ms => "90000" heartbeat_interval_ms => "30000" # Number of consumer threads per Logstash node. Configure this based on the number of partitions in Kafka topics. consumer_threads => 5 max_poll_records => "3000" auto_offset_reset => "latest" # Consumer group and type group_id => "topic-nginx-elk-hw" client_id => "topic-nginx-elk-hw" type => "topic-nginx" } } input { kafka { # Read data in text format. codec => "plain" # Topic name topics => ["topic-gateway"] # Kafka IP address bootstrap_servers => "192.168.0.1:9092,192.168.0.2:9092" # Kafka heartbeat settings. Keep the default. max_poll_interval_ms => "3000000" session_timeout_ms => "90000" heartbeat_interval_ms => "30000" # Number of consumer threads per Logstash node. Configure this based on the number of partitions in Kafka topics. consumer_threads => 5 max_poll_records => "3000" auto_offset_reset => "latest" # Consumer group and type group_id => "topic-gateway-elk-hw" client_id => "topic-gateway-elk-hw" type => "topic-gateway" } } filter { mutate { remove_field => ["@version","tags","source","input","prospector","beat"] } # Correct the index creation time, convert the time format, and set relevant fields. ruby { code => " event.set('[@metadata][localdate]', (event.get('@timestamp').time.localtime + 8 * 60 * 60).strftime('%Y.%m.%d'))" } } output { elasticsearch { # Destination cluster node addresses. No need to include the protocol. hosts => ["xxx.xxx.xxx.xxx:9200", "xxx.xxx.xxx.xxx:9200"] # Name of the index that events are written into. index => "%{type}-%{[@metadata][localdate]}" # Mandatory fields for a security-mode cluster. (Delete them for a cluster with the security mode disabled.) # user => "xxx" # Username for accessing the cluster. # password => "xxx" # Password corresponding to the username. # If SSL is enabled for the destination cluster, additionally configure the following information: # ssl => true # cacert => "/opt/logstash/extend/certs" # Path of the CA certificate used to verify the destination cluster. # ssl_certificate_verification => false # Whether to enable SSL certificate verification for the destination cluster. } } - Hidden Content: Enter the list of strings you want to hide. Then press Enter. You can skip this step.
- Click Next to configure Logstash pipeline parameters.
- pipeline.workers: Set the value to match the number of vCPUs on your Logstash node.
- pipeline.batch.size: If there are only a small number of topics in a pipeline, set it to a value greater than 1000. If there are a large number of topics in a pipeline and the data size of each topic varies significantly, set the value to less than 1000, preventing the pipeline from being jammed by a single topic.
- pipeline.batch.delay: Use the default value.
- queue type: Select memory.
- Click Create.
The newly created configuration file is displayed on the Configuration Center page. If its status changes to Available, it is created successfully.
Step 4: Start the Logstash Configuration File
Start the Logstash configuration file to have Logstash connect to Kafka, pull data from Kafka topics, process the data, and write the processed data to Elasticsearch.
- On the Configuration Center page of the Logstash cluster, select the newly created configuration file, and click Start.
- In the Start Logstash dialog box, select Keepalive to ensure that the Logstash configuration file keeps running upon service restart, Logstash consumption errors, or any other incident, so that data processing will not be interrupted.
When Keepalive is enabled, a daemon process is configured on each node. If the Logstash service becomes faulty, the daemon process will try to rectify the fault and restart the service, ensuring that the log management system runs efficiently and reliably
- Click OK to start the configuration file.
In the pipeline list, you can check the configuration file status and monitor data migration, ensuring proper data consumption and ingestion.
Step 5: Create an Index Pattern in Kibana
An index pattern defines the Elasticsearch indexes you want to visualize in Kibana. In our example, when creating an index pattern, we set the time field to @timestamp, so that Kibana can match data by time ranges.
- Log in to the CSS management console.
- In the navigation pane on the left, choose Clusters > Elasticsearch.
- In the displayed cluster list, find the target cluster, and click Access Kibana in the Operation column to log in to the Kibana console.
- In the left navigation pane on the Kibana console, choose Stack Management.
- Choose Index patterns, and click Create index pattern.
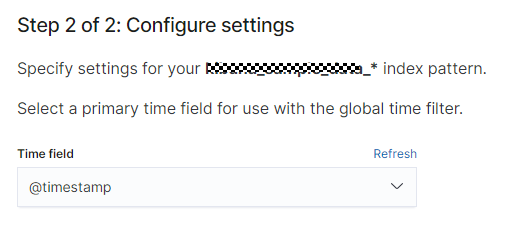
- On the Create index pattern page, set Index pattern name, for example, to topic-gateway*. Click Next step, and set Time field to @timestamp set for the index template created in Step 1: Create an Index Template in Elasticsearch. Figure 3 Index pattern configuration page

- Click Create index pattern. The new index pattern is displayed in the index pattern list.
Step 6: Query and Analyze Data
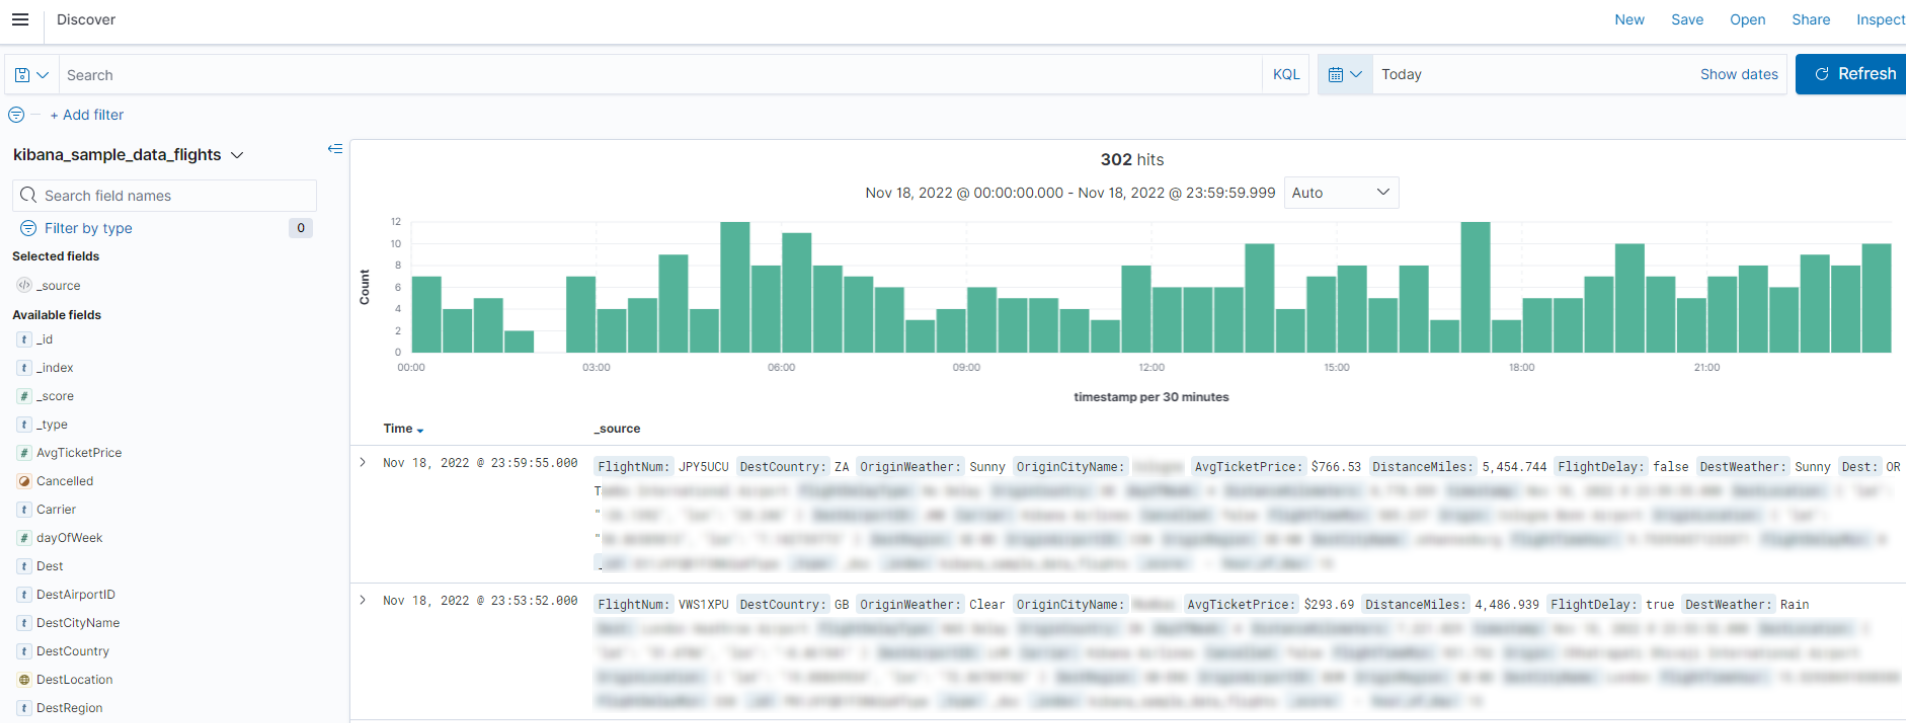
Kibana allows you to visualize and analyze data stored in Elasticsearch, making it easy to create intuitive dashboards for insights and reporting.
Feedback
Was this page helpful?
Provide feedbackThank you very much for your feedback. We will continue working to improve the documentation.See the reply and handling status in My Cloud VOC.
For any further questions, feel free to contact us through the chatbot.
Chatbot


