Creating a Prometheus Instance
You can use Prometheus to monitor metrics of CCI 2.0.
Constraints
Only one Prometheus instance for cloud services can be created in an enterprise project.
CCI 2.0 supports monitoring only in the TR-Istanbul, AF-Johannesburg, AP-Singapore, and ME-Riyadh regions.
Step 1: Create a Prometheus Instance
- Log in to the AOM 2.0 console.
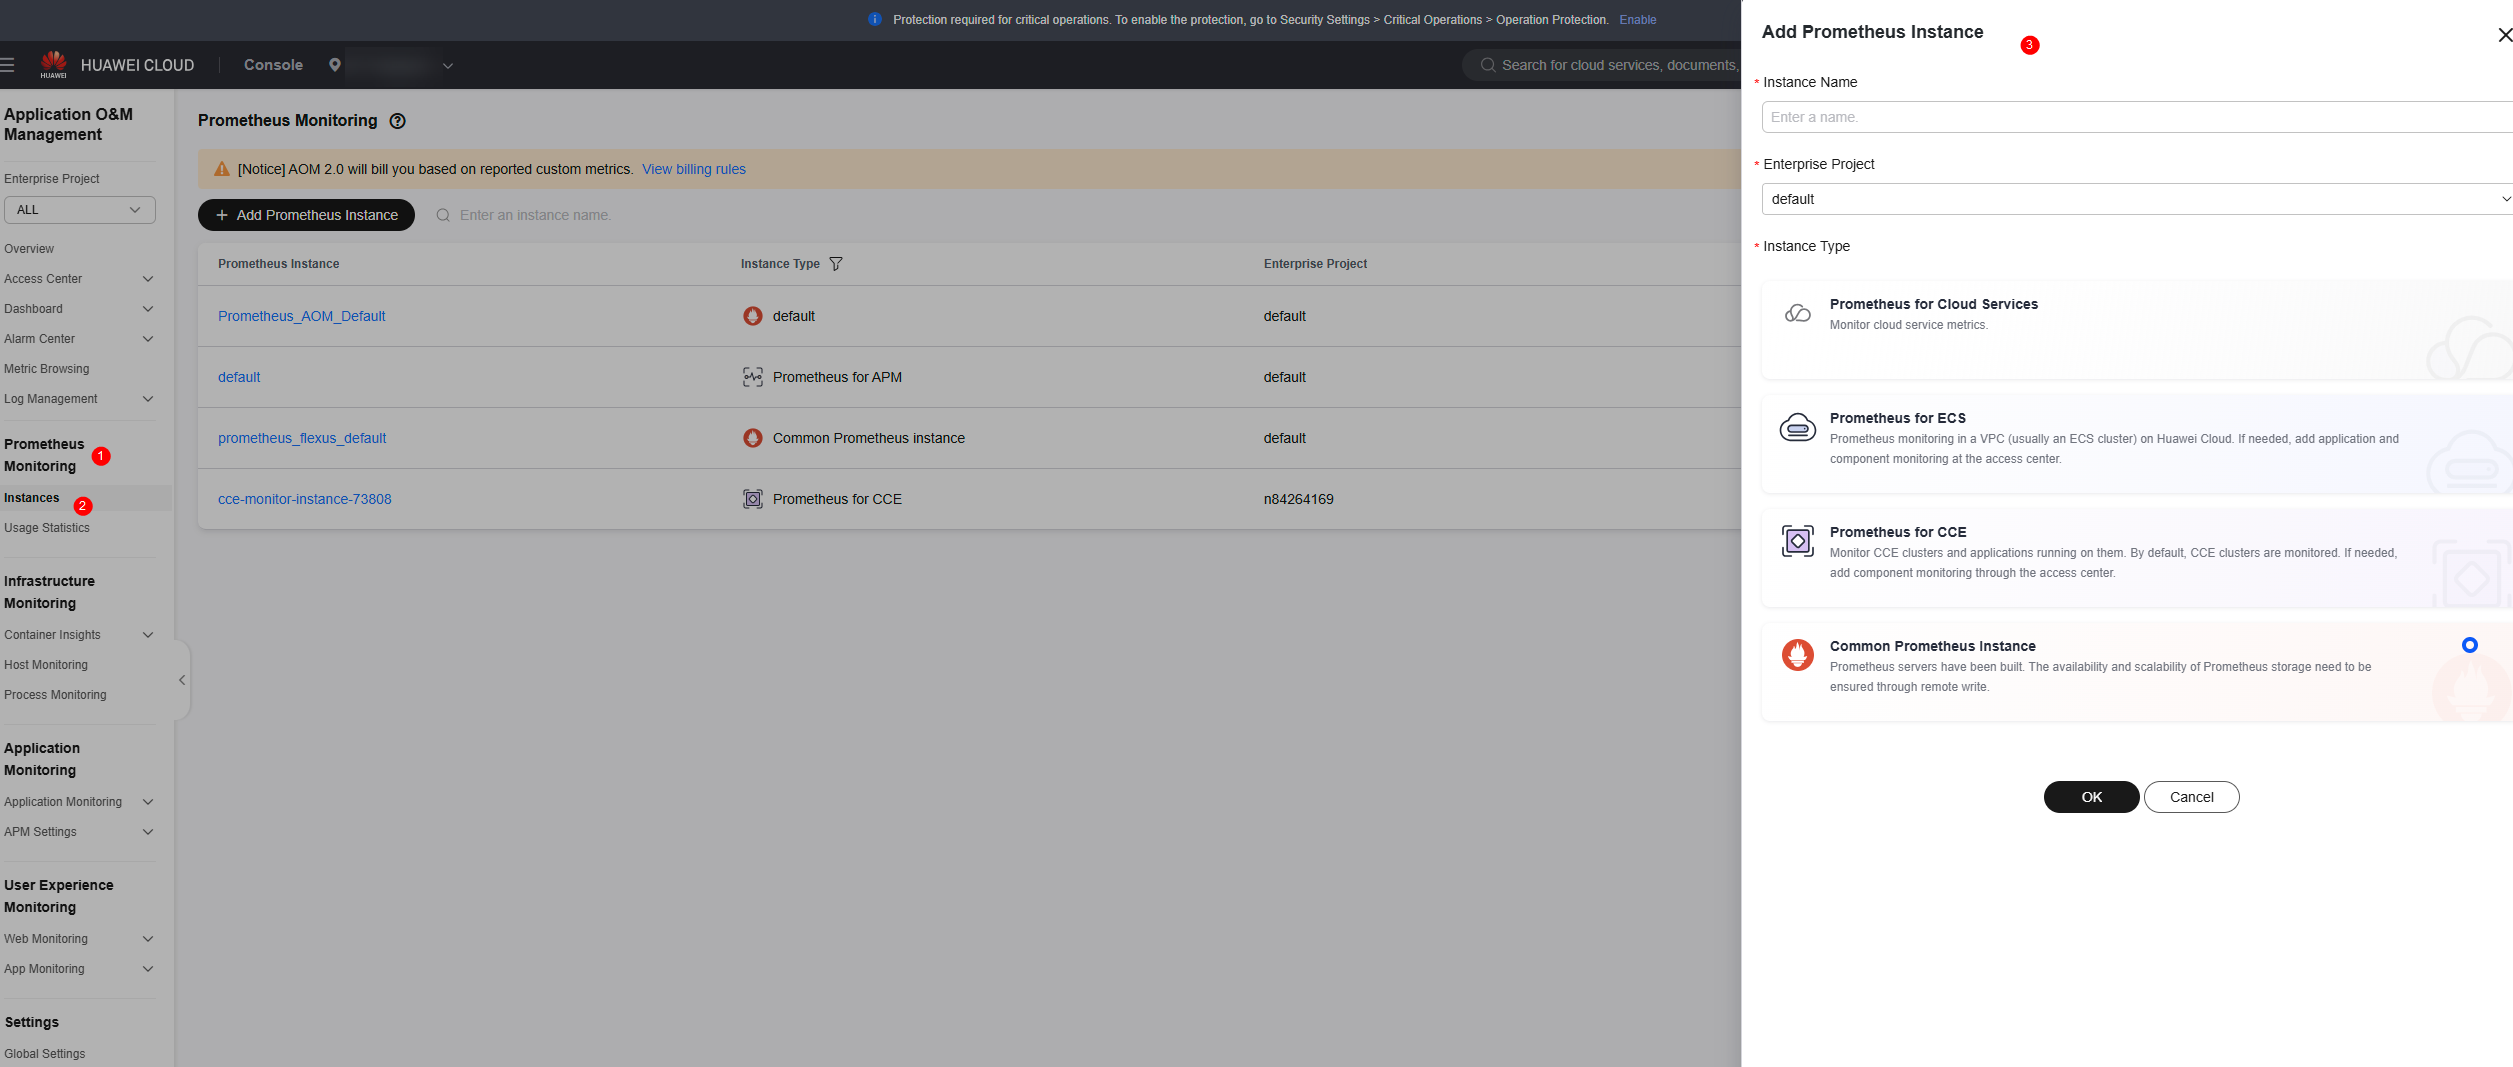
- In the navigation pane, choose Prometheus Monitoring > Instances. On the displayed page, click Add Prometheus Instance.
- Set the instance name, enterprise project, and instance type.

If the CCE Cloud Bursting Engine for CCI add-on is being used or required, the CCE cluster also needs this Prometheus instance, with the instance type set to Prometheus for CCE.

- Click OK.
Step 2: Obtain the Access Code
- Click the name of the created Prometheus instance.
- In the navigation pane, choose Settings. In the Credential area, click Add Access Code.
- Click OK.

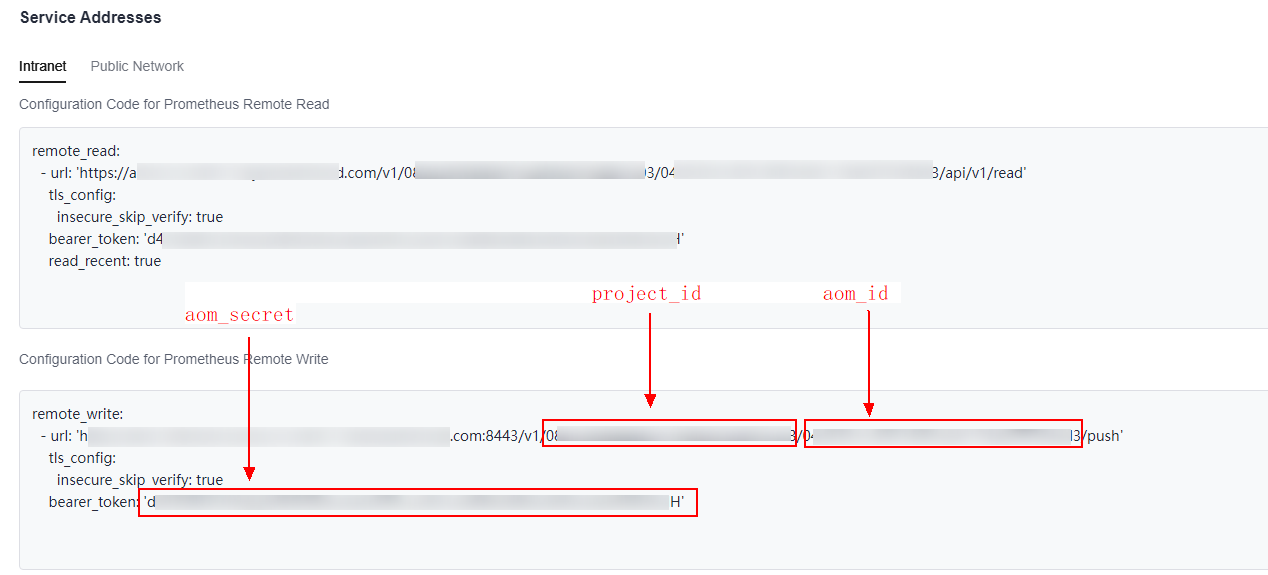
- Obtain the values of <project_id>, <aom_id>, and <aom_secret>.

- Combine the obtained values into a character string in the format of <project_id>_<aom_id>: <aom_secret>.


There must be a space after the colon (:).
- Encode the character string using Base64.
You can run the following shell commands for encoding:
project_id=<project_id>
aom_id=<aom_id>
aom_secret=<aom_secret>
echo -n "${project_id}_${aom_id}: ${aom_secret}" |base64 -w 0
- Fill the Base64-encoded character string in the following template to replace {AOMAuthBase64}, and then copy the code.
kind: Secret
apiVersion: cci/v2
metadata:
  name: cci-aom-app-secret
data:
  aom_auth: {AOMAuthBase64}
type: cci/secure-opaque
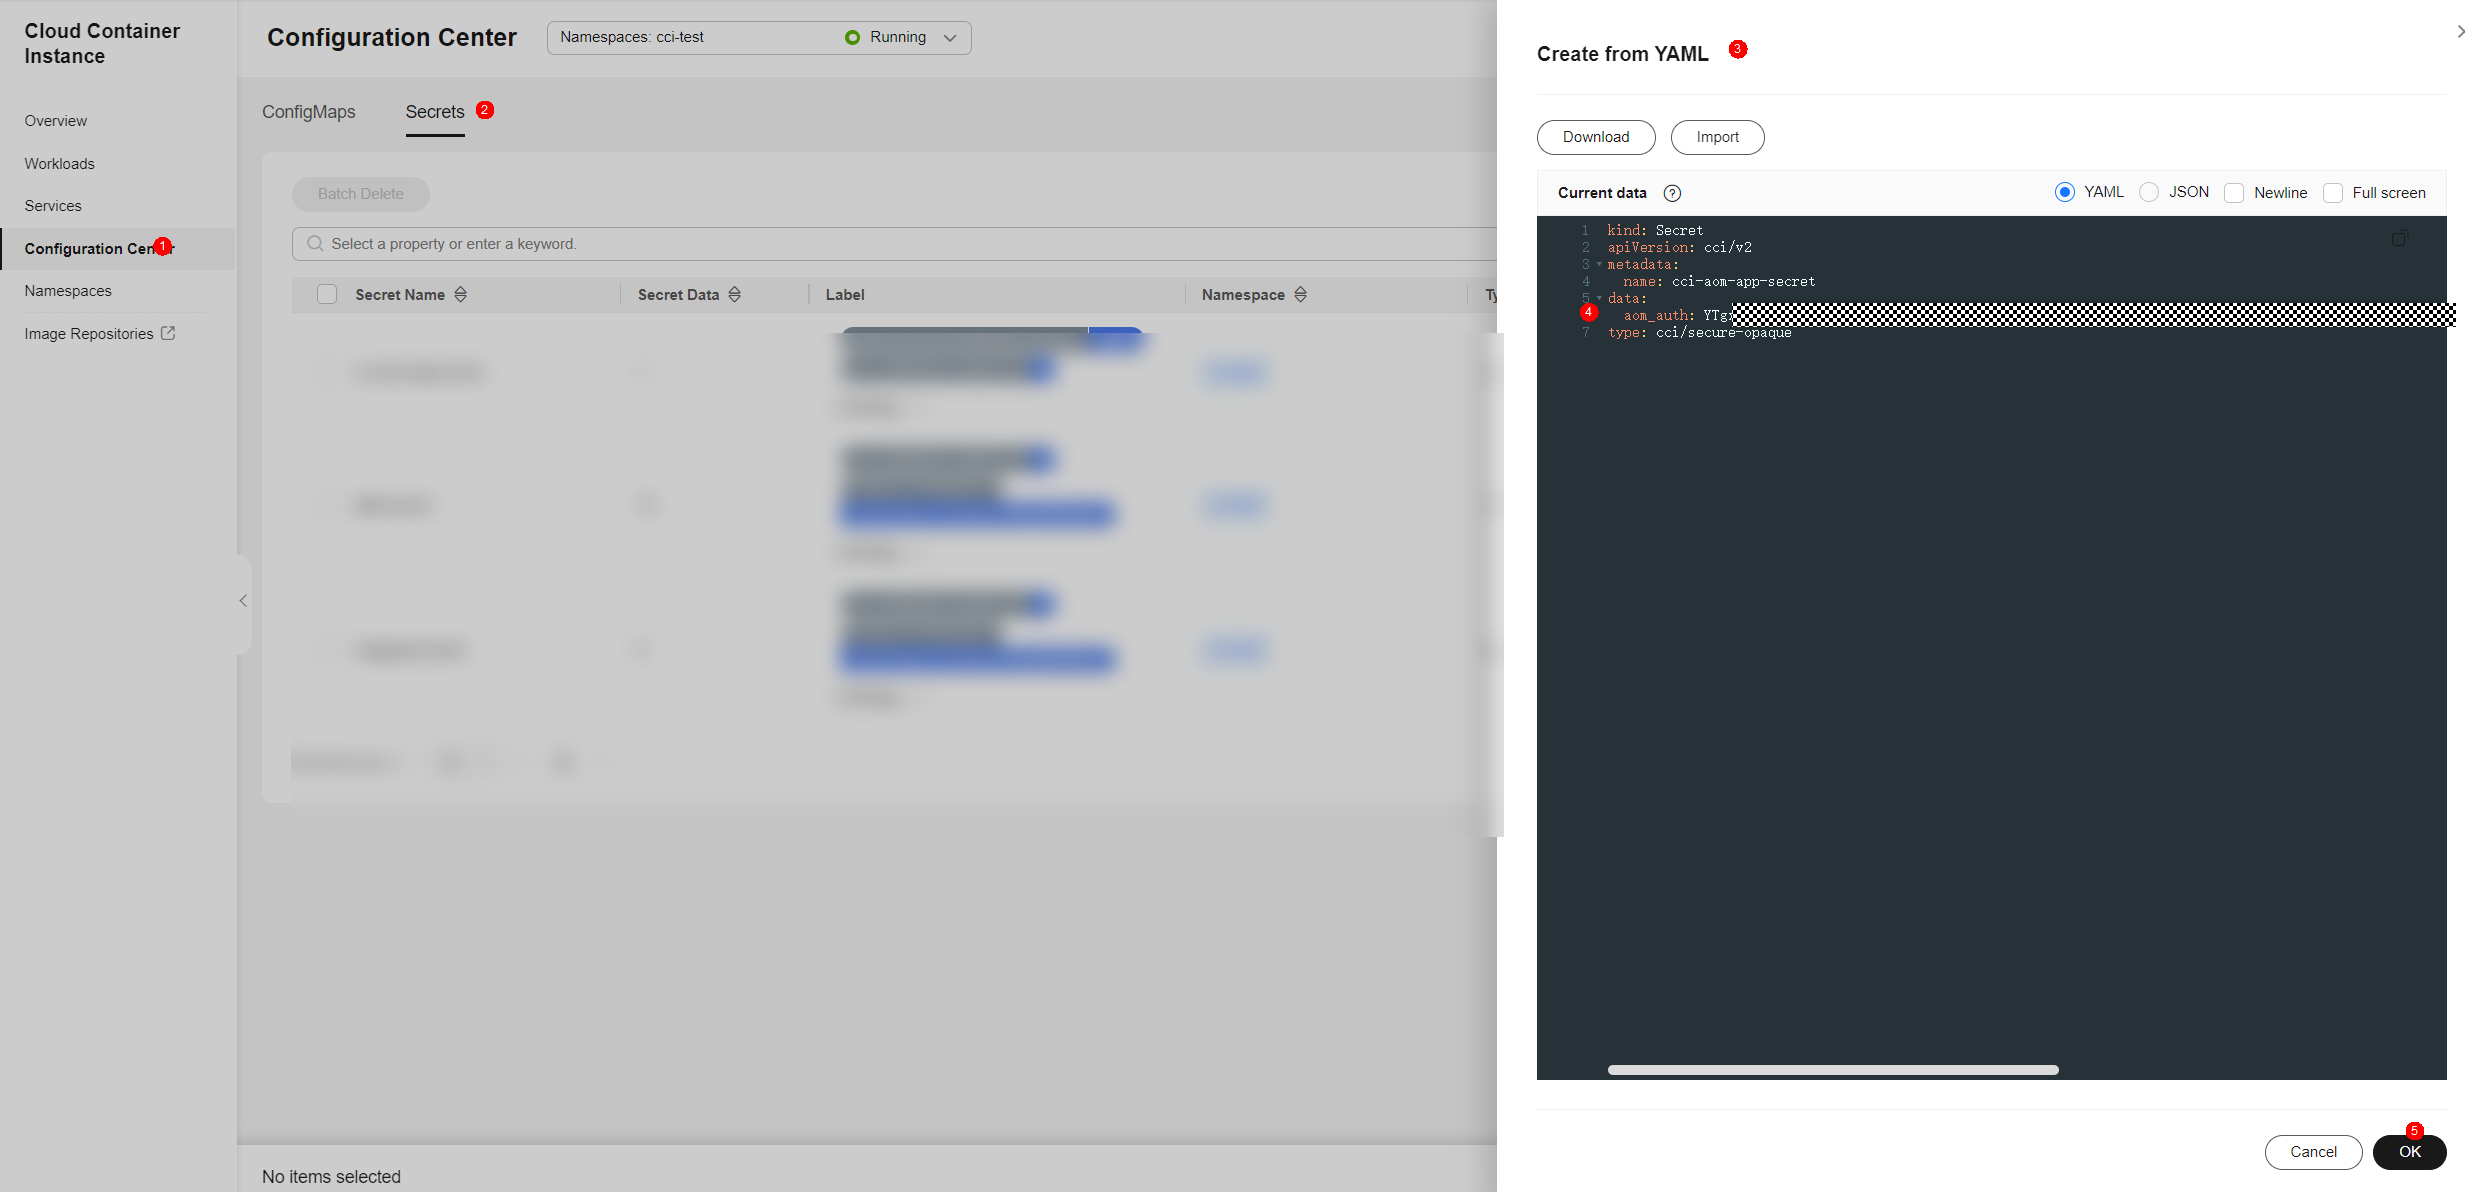
- Log in to the CCI 2.0 console.
- In the navigation pane, choose Configuration Center.
- Click the Secrets tab.
- Click Create from YAML and use the copied code to replace the code on the CCI 2.0 console to create an AOM app secret.

Step 3: Create a Pod
- Log in to the CCI 2.0 console.
- In the navigation pane, choose Workloads. On the displayed page, click the Pods tab.
- Click Create Pod and enter the required information. For details, see Creating a Pod.

- Click Create Now.
Step 4: View Monitoring Data
- Log in to the AOM 2.0 console.
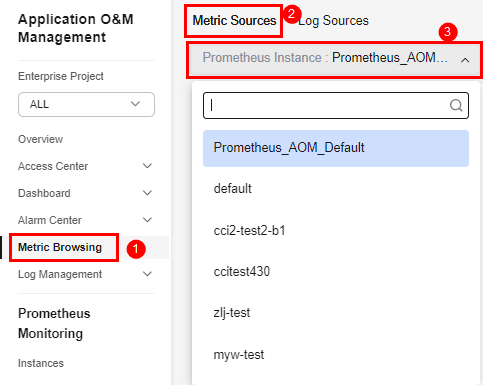
- In the navigation pane, choose Metric Browsing.
- On the Metric Sources tab, select the Prometheus instance created in Step 1: Create a Prometheus Instance.

- On the Prometheus statement tab, enter a Prometheus statement in the search box and click
 .
.

You can use Prometheus statements to query and monitor multiple metrics of CCI 2.0. Before using Prometheus statements, ensure that the pod has been connected to the Prometheus instance.
Feedback
Was this page helpful?
Provide feedbackThank you very much for your feedback. We will continue working to improve the documentation.See the reply and handling status in My Cloud VOC.
For any further questions, feel free to contact us through the chatbot.
Chatbot


