Help Center/
Application Performance Management/
Best Practices(2.0)/
Locating Performance Problems Using APM Profiler
Updated on 2025-03-27 GMT+08:00
Locating Performance Problems Using APM Profiler
Use APM Profiler (a performance profiling tool) to locate the code that consumes excessive resources.
Prerequisites
- An APM Agent has been connected.
- The Profiler function has been enabled.
- You have logged in to the APM console.
Handling High CPU Usage
- In the navigation pane, choose Application Monitoring > Metrics.
- In the tree on the left, click
 next to the target environment.
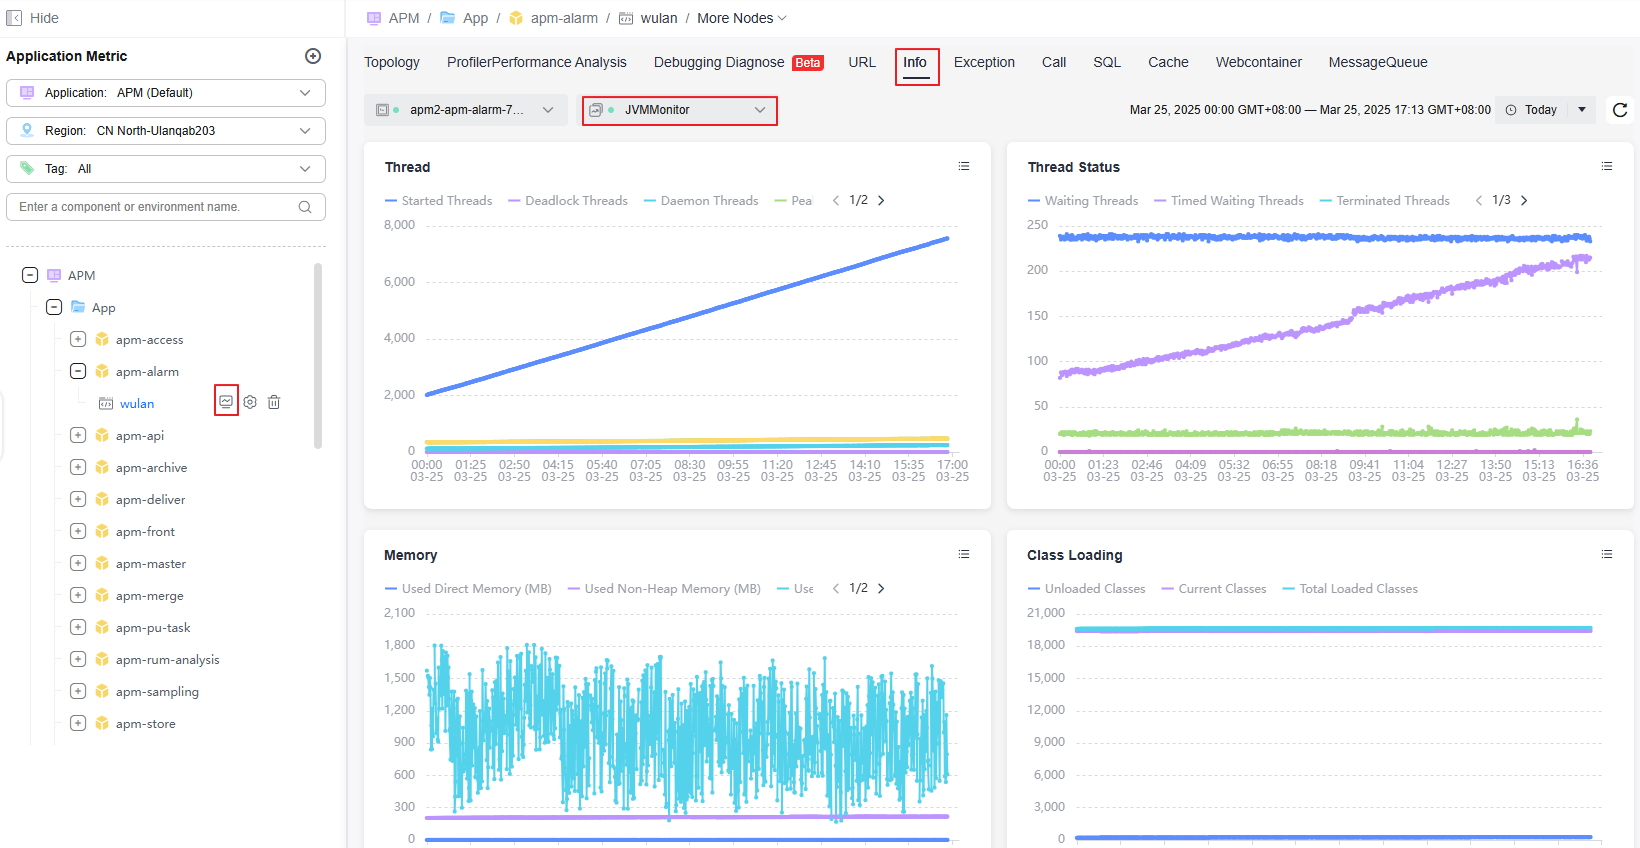
 - Click the JVM tab. On the displayed page, select JVMMonitor from the monitoring item drop-down list.
Figure 1 Viewing JVM monitoring data
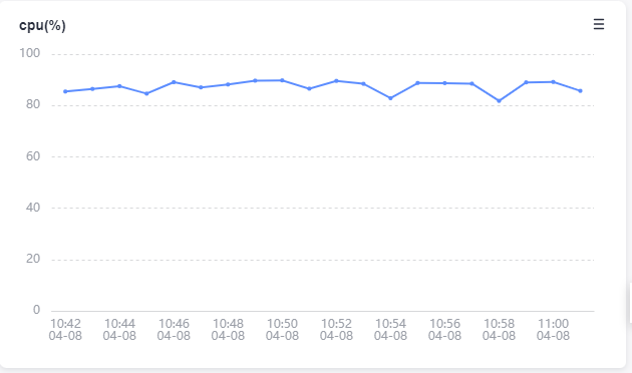
- Check the cpu(%) graph. The CPU usage remains higher than 80%.
Figure 2 CPU (%)
- Click the Profiler Performance Analysis tab.
- Click Performance Analysis. On the displayed page, select CPU Time for Type.
Figure 3 Profiler flame graph

- Analyze the flame graph data. The java.util.LinedList.node(int) method occupies 66% of the CPU, and the corresponding service code method is countPages(List).
Figure 4 Profiler flame graph analysis

- Analyze the service code. countPages(List) traverses the position indexes of the input parameter set list. However, when the input data is linked lists, position index-based traversal will be inefficient.
Figure 5 Code analysis

- Fix the code. Specifically, change the list traversal algorithm to "enhanced for loop".
Figure 6 Fixing code

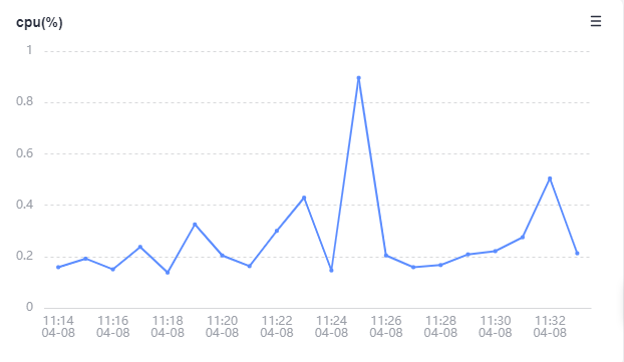
- After the optimization, repeat steps 4 and 5. The CPU usage is lower than 1%.
Figure 7 CPU usage after optimization
Handling High Memory Usage
Prerequisite: The test program is started, and the heap size is set to 2g(-Xms2g -Xmx2g).
- In the navigation pane, choose Application Monitoring > Metrics.
- In the tree on the left, click
 next to the target environment.
 - Click the JVM tab, select the GC monitoring item. GC events occur frequently.
- Select the JVMMonitor monitoring item to check JVM monitoring data.
- Click the Profiler Performance Analysis tab.
- Click Performance Analysis. On the displayed page, select the Allocated Memory instance. Locate the method with the most allocated memory based on the Self column on the right.
Figure 8 Memory flame graph
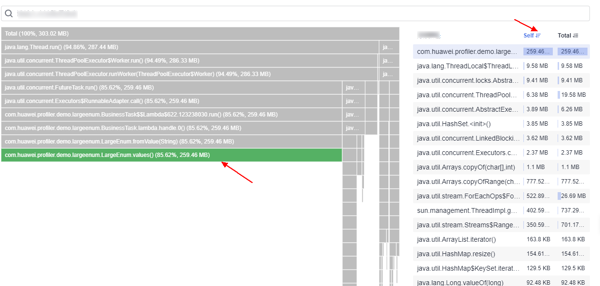
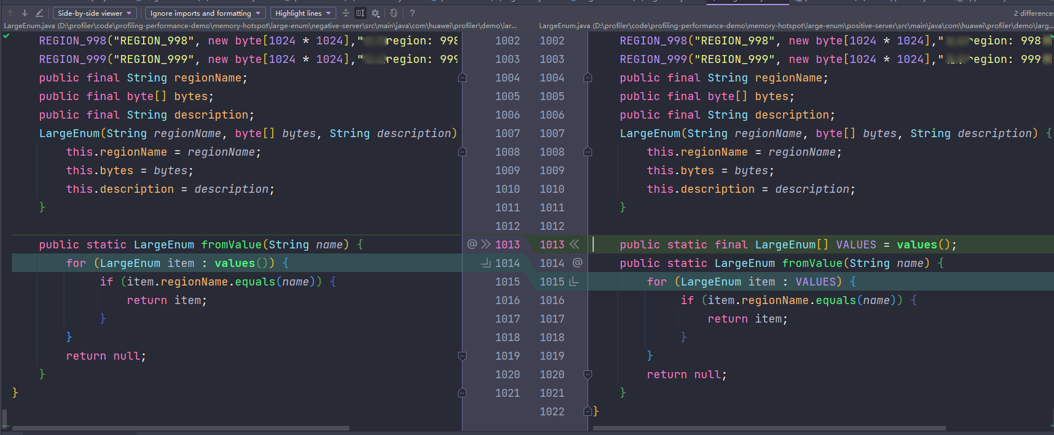
- Check the code. LargeEnum is an enumeration class and has defined a large number of constants. The enumeration class method values() implements functions through array clone. That is, each time the values() method is called, an enumeration array will be copied at the bottom layer. As a result, heap memory is frequently allocated and GC often occurs.
Figure 9 Checking the code

- Define values as a constant to avoid frequent calling of enum.values().
Figure 10 Resolving the problem
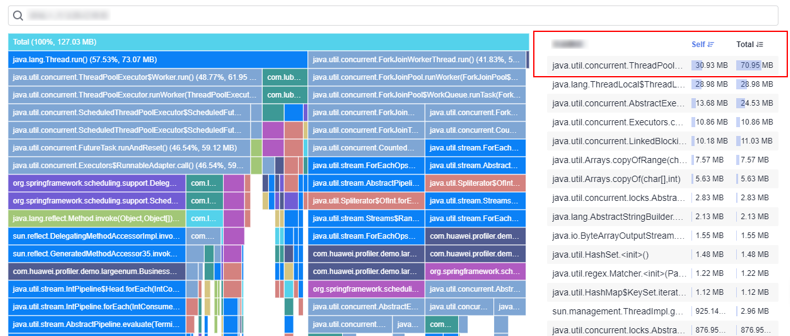
- Repeat steps 3 to 6. The number of GC times decreases greatly and there is no memory allocated to enum.values() in the flame graph.
Figure 11 Flame graph after optimization
Handling Slow API Response
- In the navigation pane, choose Application Monitoring > Metrics.
- In the tree on the left, click
 next to the target environment.
 - Click the URL tab. The API responses are slow. The average response time is about 80s.
- Click the Profiler Performance Analysis tab.
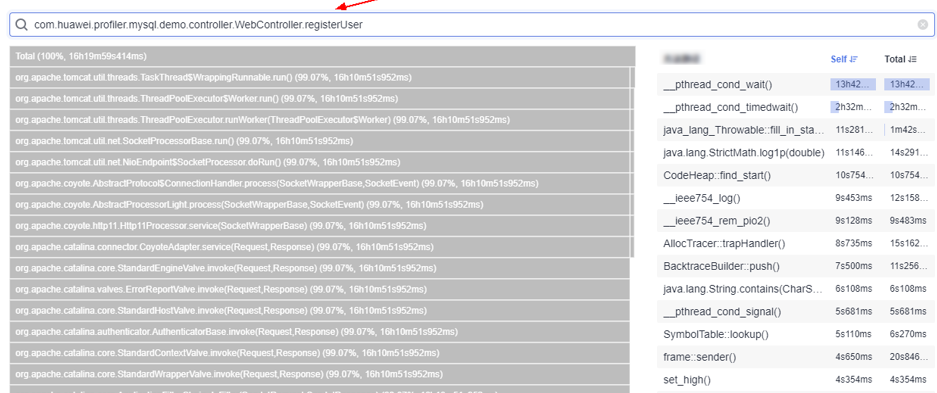
- Click Performance Analysis. On the displayed page, select the Latency instance and enter the method of the API.
Figure 12 Performance analysis
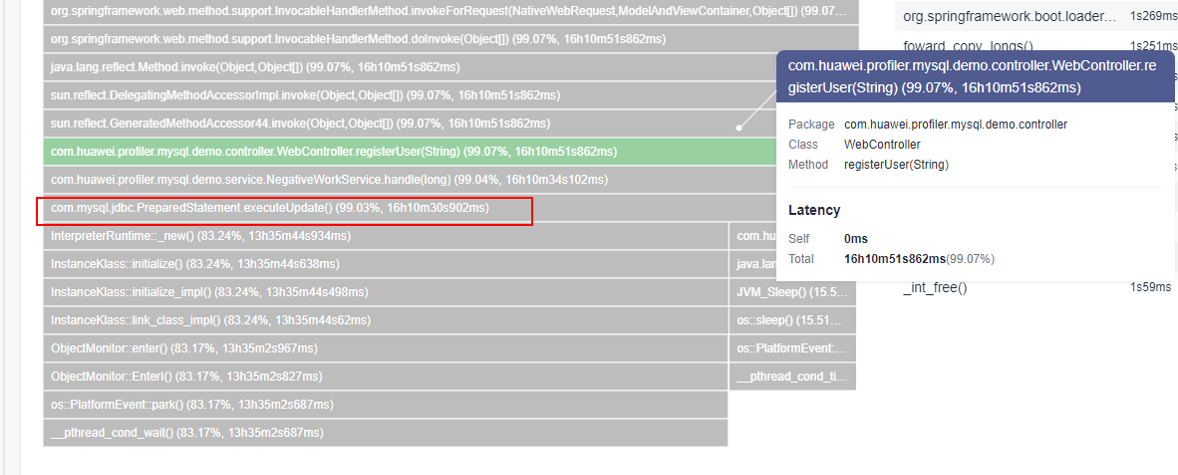
- Check the call stack and find the time-consuming method. As shown in the following figure, the executeUpdate() method in NegativeWorkService#handle consumes the most time.
Figure 13 Checking the call stack
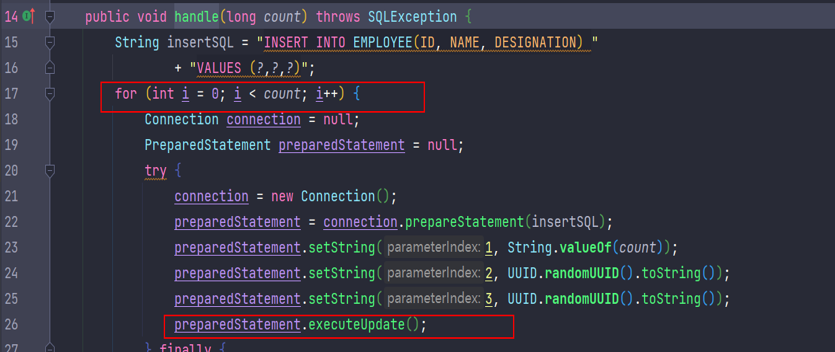
- Check the NegativeWorkService#handle method. The cause is that database insertion is performed in the loop.
Figure 14 Checking NegativeWorkService#handle
- Change the configuration to batch data insertion to resolve the problem.
Figure 15 Resolving the problem
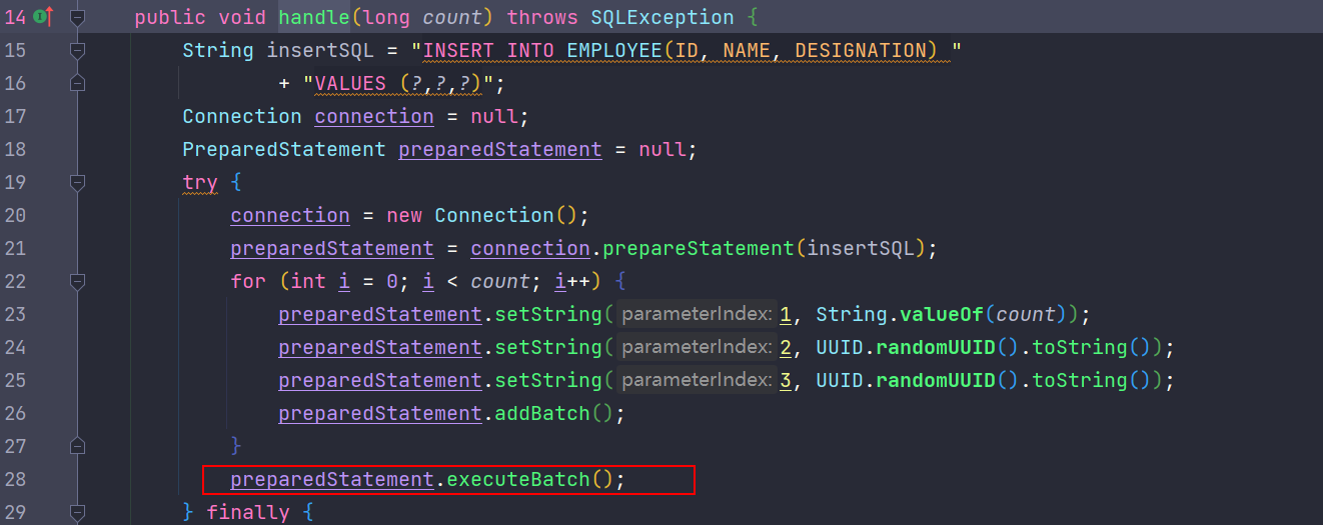
- Check the average response time. It is reduced from 80s to 0.2s.
Feedback
Was this page helpful?
Provide feedbackThank you very much for your feedback. We will continue working to improve the documentation.See the reply and handling status in My Cloud VOC.
The system is busy. Please try again later.
For any further questions, feel free to contact us through the chatbot.
Chatbot


