
Line Charts
The query and analysis results can be displayed in a line chart.
A line chart is used to display the change of a group of data in a period and show the data change trend.
Procedure
- Log in to the management console.
- Click
 in the upper part of the page and choose Security > SecMaster.
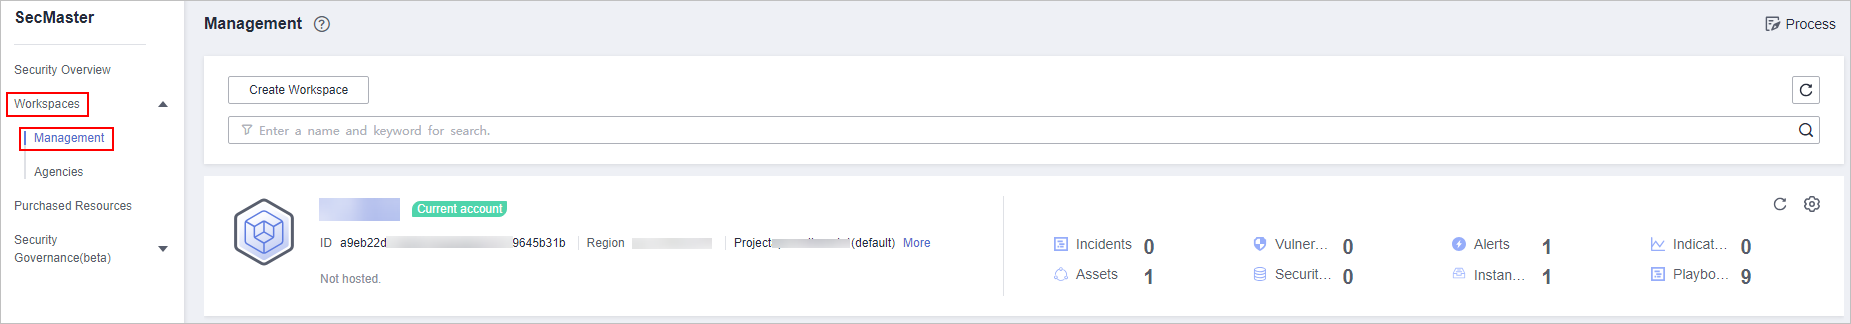
 - In the navigation pane on the left, choose Workspaces > Management. In the workspace list, click the name of the target workspace.
Figure 1 Workspace management page
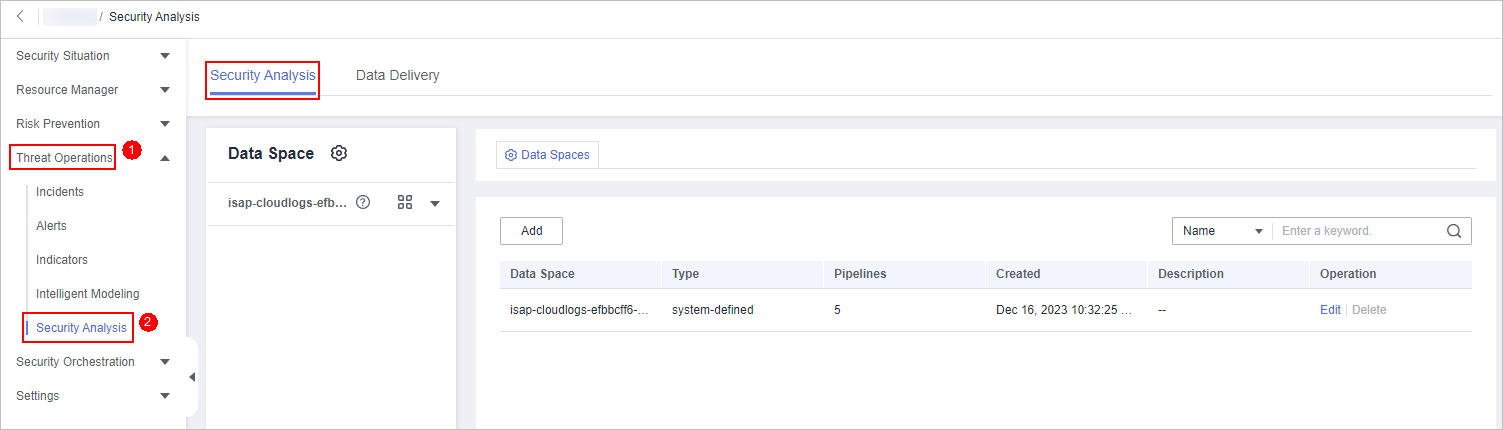
- In the navigation pane on the left, choose . The security analysis page is displayed.
Figure 2 Accessing the Security Analysis tab page
- In the data space navigation tree on the left, click a data space name to show the pipeline list. Click a pipeline name. On the displayed page, you can search the pipeline data.
Figure 3 Pipeline data page
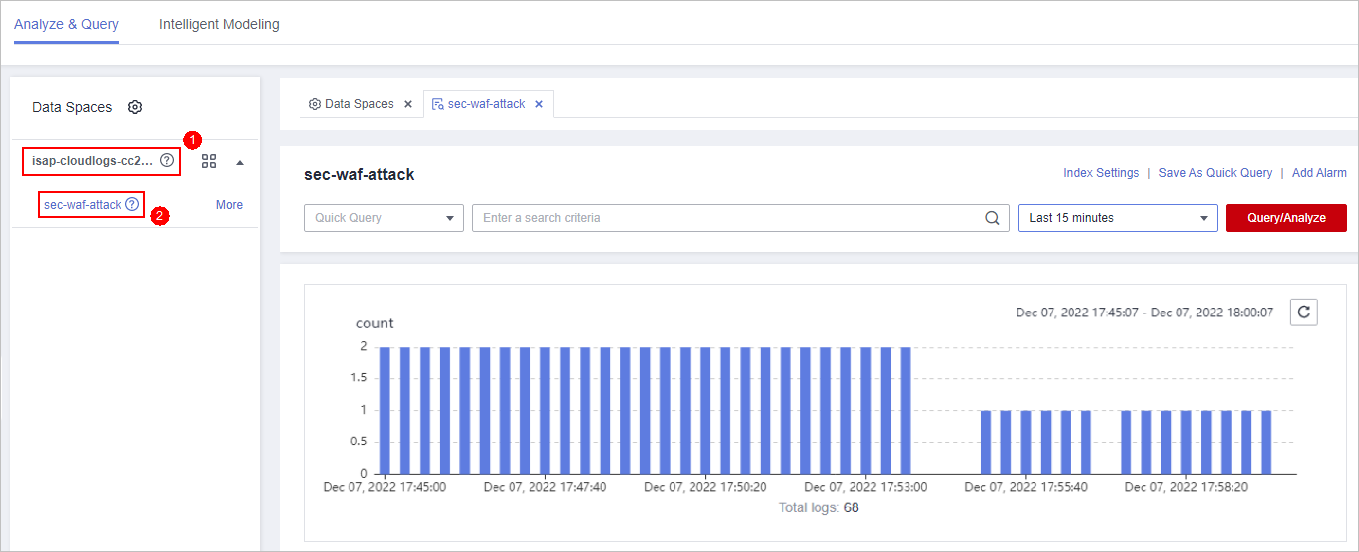
- Enter the query and analysis statement, set the time range, and click Query/Analyze.
- Click the Charts tab. In the Chart Type area on the right of the page, click
 .
Figure 4 Line chart statistics
.
Figure 4 Line chart statistics
- Set line chart parameters.
Table 1 Line chart parameters Category
Parameter
Description
Base Settings
Title
Customized line chart title
Chart Settings
X-Axis Title
Customized title of the X axis
Y-Axis Title
Customized title of the Y axis
X-Axis Field
Field to be displayed on the X axis
Y-Axis Field
Field to be displayed on the Y axis
Legend
Show Legend
Determine whether to display the legend.
Position
This parameter is mandatory when the legend display function is enabled.
Position of the legend in the chart. The options are Top, Bottom, Left, and Right.
After the chart is configured, you can preview the configured data analysis result on the left.
Related Operations
- Adding an indicator card: After the configuration, if you want to save the indicator information as a card, click Add as Indicator Card in the upper right corner of the table to add an indicator card. In the dialog box that is displayed, set the indicator card name and click Save.
- Download logs: After the chart configuration, you can click Download in the upper right corner of the table to download the current query analysis data to the local PC.
- Hide configuration: After the chart configuration, you can click Hide Configuration on the right of the Preview to hide the parameters.
- Show configuration: After the chart configuration is hidden, you can click Show Configuration on the right of Preview to expand and set parameters.
Feedback
Was this page helpful?
Provide feedbackThank you very much for your feedback. We will continue working to improve the documentation.See the reply and handling status in My Cloud VOC.
For any further questions, feel free to contact us through the chatbot.
Chatbot


