Locating an Unhealthy Backend Server Using Access Logs
Scenarios
With LTS, you can view logs of requests to shared load balancers at Layer 7 and analyze response status codes to quickly locate unhealthy backend servers.
Preparations
- You have created a shared load balancer that can work at Layer 7.
- You have enabled LTS.
Creating a Log Group
- Log in to the management console.
- In the upper left corner of the page, click
 and select the desired region and project.
 - Hover on
 in the upper left corner to display Service List and choose Management & Governance > Log Tank Service.
 - In the navigation pane on the left, choose Log Management.
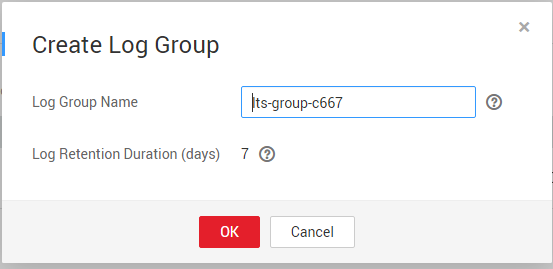
- On the displayed page, click Create Log Group. In the displayed dialog box, enter a name for the log group.

- Click OK.
Creating a Log Stream
- Locate the created log group and click its name.
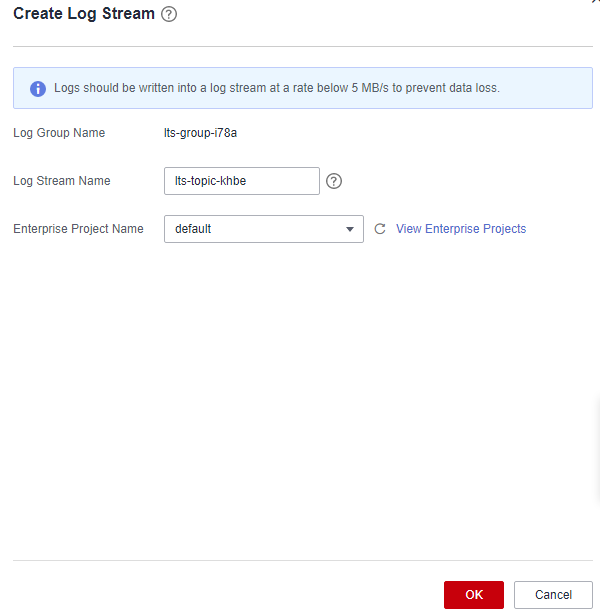
- Click Create Log Stream. In the displayed dialog box, enter a name for the log stream.
Figure 1 Creating a log stream

- Click OK.
Configuring Access Logging
- Click Service List. Under Networking, click Elastic Load Balance.
- Locate the load balancer and click its name.
- Under Access Logs, click Configure Access Log.
- Enable access logging and select the created log group and log stream.
- Click OK.

Ensure that the log group is in the same region as the load balancer.
Viewing Access Logs
- On the ELB console, click the name of the load balancer and click Access Logs to view logs.

- On the LTS console, go to the page that displays all log streams, locate the log stream and click View or Search in the Operation column.

Locating the Server
The following is a log that records an exception:
1554944564.344 - [2019-04-11T09:02:44+08:00] elb 10.133.251.171:51527 500 "GET http://10.154.73.58/lrange/guestbook HTTP/1.1" 411 3726 3545 19.028 "500" "0.009" "19.028" "19.028" "172.17.0.82:3000" "Mozilla/5.0 (Windows NT 6.1; Win64; x64) AppleWebKit/537.36 (KHTML, like Gecko) Chrome/73.0.3683.103 Safari/537.36" "http://10.154.73.58:5971/" "-" loadbalancer_ed0f790b-e194-4657-9f97-53426227099e listener_b21dd0a9-690a-4945-950e-b134095c6bd9 6b6aaf84d72b40fcb2d2b9b28f6a0b83
Log analysis
At 09:02:44 GMT+08:00 of April 11, 2019, the load balancer received a GET/HTTP/1.1 request from the client (whose IP address and port number are 10.133.251.171 and 51527 respectively) and then routed the request to a backend server (which uses 172.17.0.82 and port 3000 to receive requests). The load balancer then received 500 Internal Server Error from the backend server and returned the status code to the client.
Analysis result
The backend server was abnormal and failed to respond to the request.

172.17.0.82:3000 is the private IP address of the backend server.
Feedback
Was this page helpful?
Provide feedbackThank you very much for your feedback. We will continue working to improve the documentation.See the reply and handling status in My Cloud VOC.
For any further questions, feel free to contact us through the chatbot.
Chatbot


