

Viewing the Test Quality Dashboard
CodeArts TestPlan provides dashboards with more than 10 quality metrics, such as the requirement coverage rate, requirement pass rate, case execution rate, and legacy DI, for evaluation of functions, performance, and reliability. You can clearly learn about the progress and risks of the overall test plan through the dashboard.
Project-Level Dashboard
The project dashboard displays statistics on the test case library and test plan. The items include the requirement coverage rate, number of bugs, test case pass rate, test case completion rate, and details of associated bugs.
Quality Report of the Test Case Library
Log in to the CodeArts homepage, search for your target project, and enter the project. In the navigation pane, choose Testing > Quality Report. The quality report page is displayed by default.
| Report Item | Description |
|---|---|
| Requirement Coverage | Percentage of tested requirements in the selected sprint and module. This reflects function test coverage.
NOTE: In Scrum projects, only statistics on the Feature and Story requirements are collected by default. To collect statistics on the Epic requirements, select epic. |
| Defects | Collects statistics on the total number of defects in the selected sprint and module. The statistics are grouped by defect severity. To monitor a bug, check its group. A closed bug will be grouped into Done. To view or change bug status groups, choose Settings > Work Item > Common Statuses, and locate the Status Category column. NOTE: The number of unresolved bugs includes the following:
|
| Case Pass Rate | Pass rate of test cases in the selected sprint and module. The test case pass rate and bugs reflect the overall product quality. The statistics are grouped based on the test case result. The test cases that are not executed are included in the Not executed group. Pass rate = Number of successful cases/Total number of cases. Pass rate of executed test cases is calculated based on data from the chosen sprint and module. Pass rate of executed test cases = Number of successful cases/Total number of executed cases. |
| Key Data Dashboard | Collects statistics on the requirement coverage, total number of defects, case pass rate, and case completion rate associated with manual and API automation test cases in the selected sprint and module. Click |
| Requirement Test | Collects statistics on associated requirements, including total number of associated cases, pass rate, execution rate, and total number of associated bugs. It also displays the corresponding requirement IDs. The requirements can be filtered by status. |
| Defects Test | Displays a list of associated defects. You can filter the list by defect name or ID. Click a defect name to view its details page. When Test case library is selected, defect statistics are unavailable. To view defect statistics, switch to the corresponding test plan. |

Quality Report of a Test Plan
On the Quality Report page, click the Test case Library drop-down list in the upper left corner and select a test plan. The quality report page of the selected test plan is displayed.
The quality report of a test plan is not filtered by sprint or module. In addition, it shows the test case completion rate and the risk description of the test plan. Other report items are the same as those of the quality report of the test case library.
| Report Item | Description |
|---|---|
| Case Completion Rate | Number of completed test cases in the selected plan. This reflects the test progress. The statistics are grouped by case status. Completion rate = Number of completed cases/Total number of cases |
| Risk | Risk of the test plan. You can evaluate the risk level of the test plan and add risk description. |
| Manual Test | Requirement coverage rate, total number of bugs, pass rate, and completion rate of manual test cases. |
| Auto API Test | Requirement coverage rate, total number of bugs, pass rate, and completion rate of automated API test cases. |
Personal Dashboard
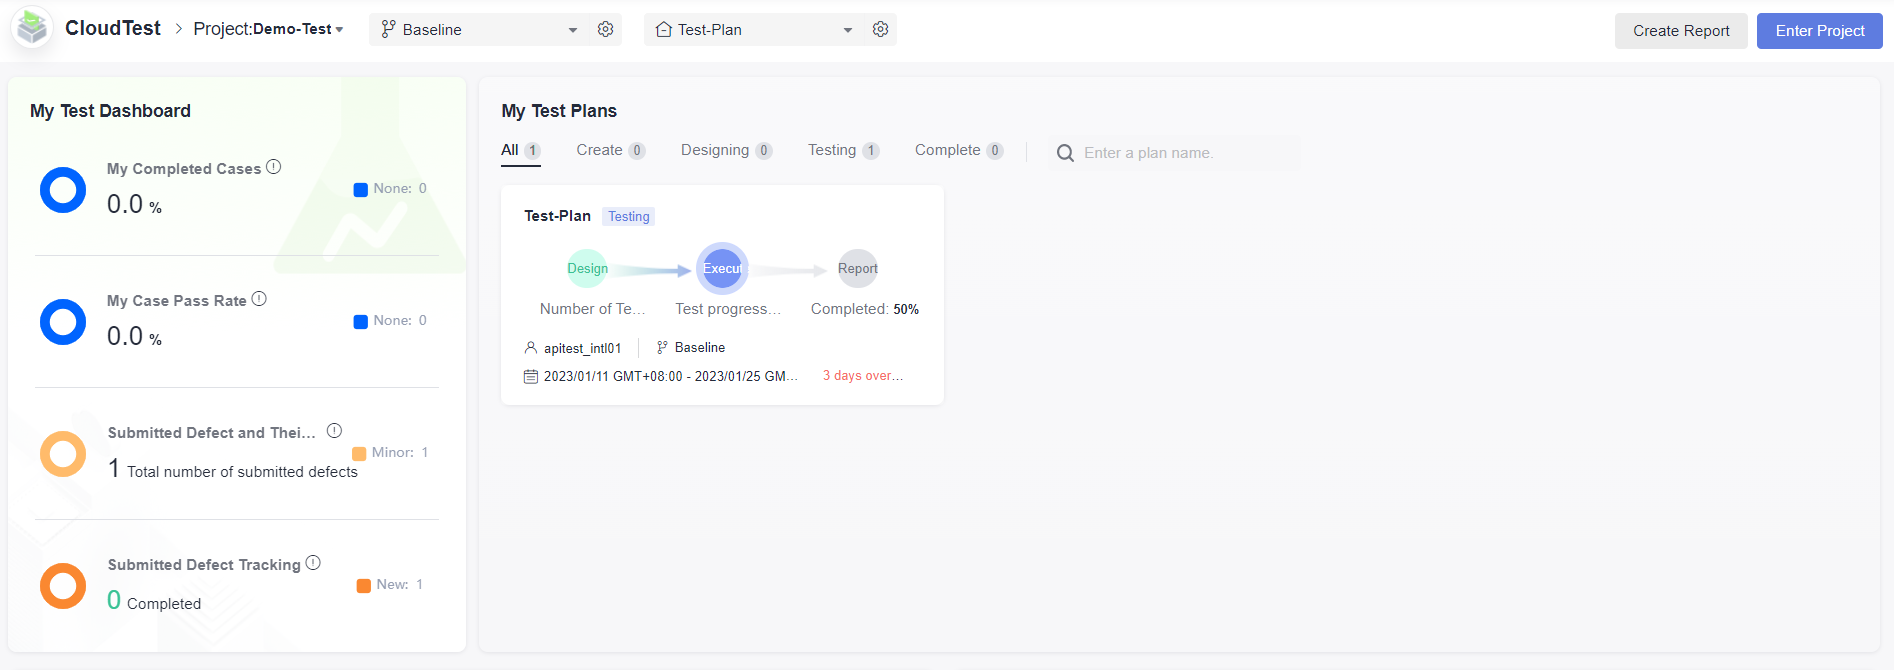
- Personal case completion rate, case pass rate, submitted bug status, submitted bug severity, bug statistics based on the test case library and test plan in the project
- Personal test plans, test tasks, and submitted bugs based on the test case library and test plan in the project
Custom Test Reports
Create a custom test report in either of the following ways:
- On the homepage
- Log in to the CodeArts homepage. On the top navigation bar, choose Services > TestPlan. The homepage is displayed.
- Click Create Report in the upper right corner, or click Add Report in the lower left corner.
- On the displayed Select Report Type page, select the type of the report to be created.
- On the quality report page
- Log in to the CodeArts homepage, search for your target project, and click the project name to access the project.
- In the navigation pane, choose Testing > Quality Report.
- Select a test case library or test plan, select the report type (Custom Test Report, Custom Distribution Report, and Progress Test Reports), and click Add Report.
- On the displayed Select Report Type page, select the report type as required.
What is your overall rating for this page?
Thank you very much for your feedback. We will continue working to improve the documentation.See the reply and handling status in My Cloud VOC.
For any further questions, feel free to contact us through the chatbot.
Chatbot


