Viewing DDS Metrics
Scenarios
Cloud Eye monitors the statuses of DDS DB instances. You can view DDS metrics on the management console.
Monitored data takes some time before it can be displayed. The DDS status displayed on the Cloud Eye console is about 5 to 10 minutes delayed. When you create a new DDS DB instance, it takes 5 to 10 minutes before monitoring data is displayed on Cloud Eye. The monitoring data is retained for 30 days.
If you receive an alarm (for example, indicating that the data disk space is insufficient), you need to filter the instance nodes to check whether each node is normal when you view the instance monitoring data for problem location and analysis.
Prerequisites
- The DDS DB instance is running normally.
Cloud Eye does not display the metrics of faulty or deleted DB instances or nodes. You can view the monitoring information only after the instance is restarted or recovered.
- The DB instance has been properly running for at least 10 minutes.
For a newly created DB instance, you need to wait a bit before the monitoring metrics show up on Cloud Eye.
Procedure
- Log in to the management console.
- Click
 in the upper left corner and select a region and a project.
 - Click
 in the upper left corner of the page and choose Databases > Document Database Service.
 - On the Instances page, click the target DB instance.
- In the navigation pane on the left, choose Advanced O&M.
- View metrics.
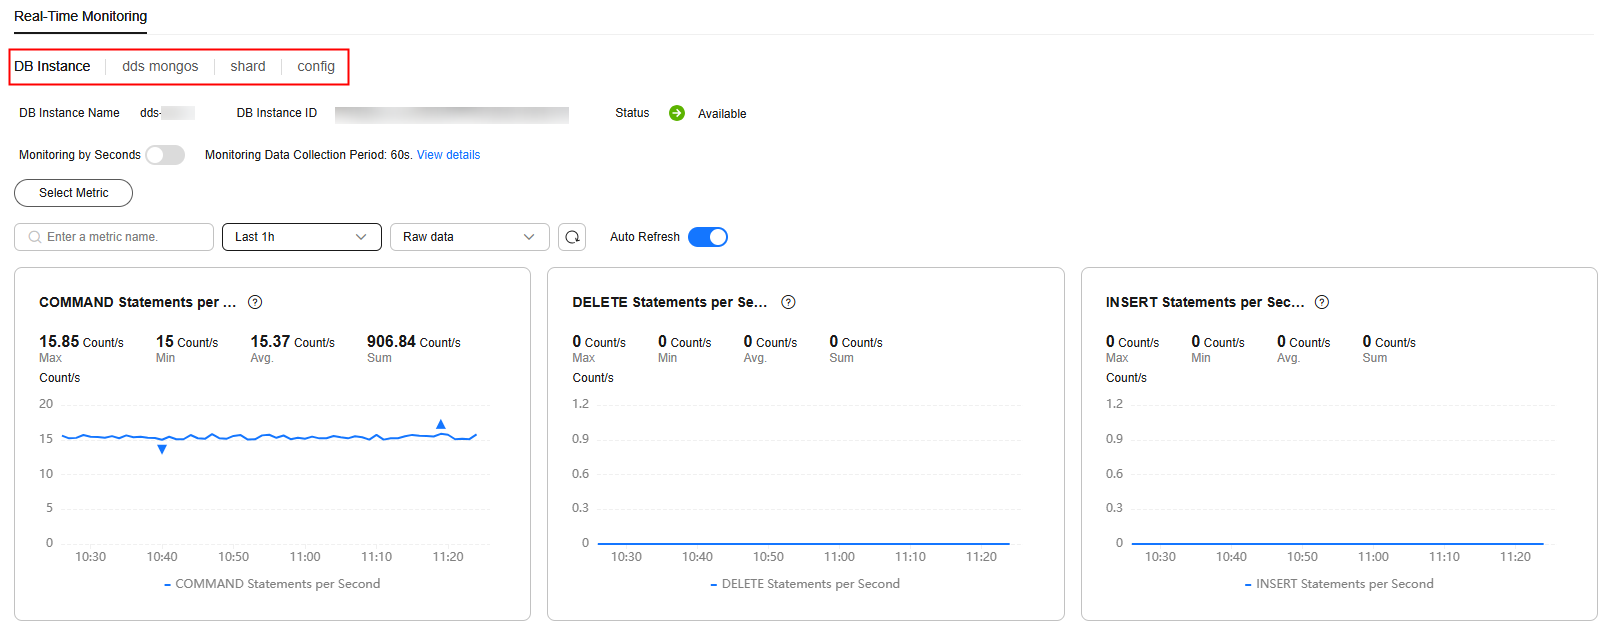
- For cluster instances, you can view metrics of instances, and dds mongos, shard, and config nodes. Figure 1 Viewing metrics of a cluster instance

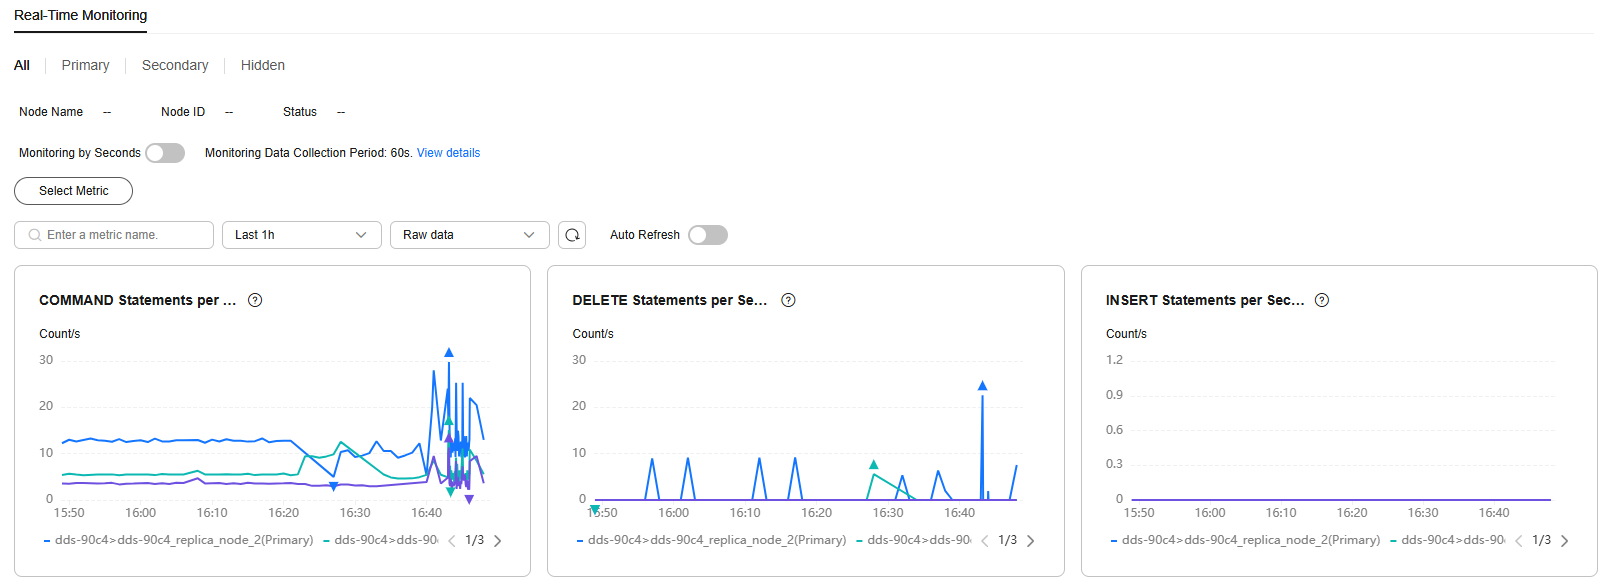
- For replica set instances, you can view metrics of the primary, secondary, and hidden nodes. Figure 2 Viewing metrics of a replica set instance

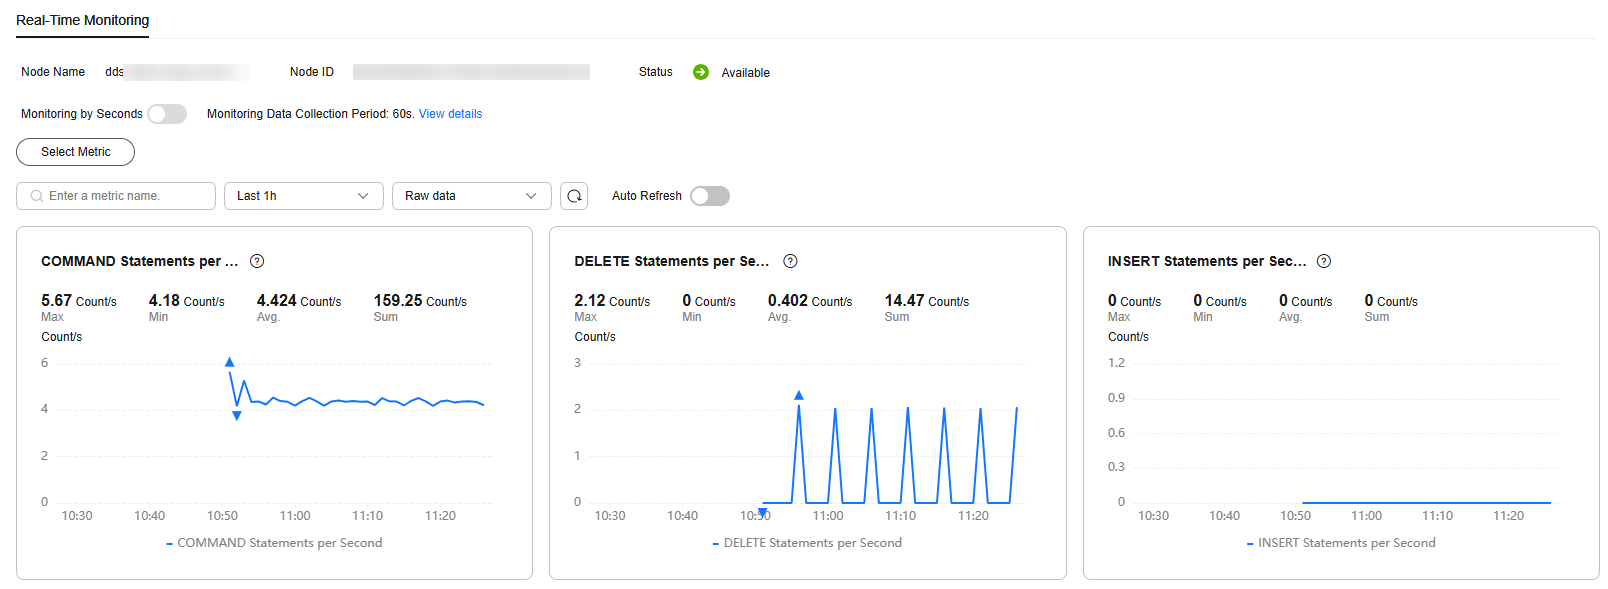
- For single node instances, you can view node metrics. Figure 3 Viewing metrics of a single node instance

- For cluster instances, you can view metrics of instances, and dds mongos, shard, and config nodes.
- View monitoring metrics of cluster instances, cluster instance nodes, and replica set instance nodes.
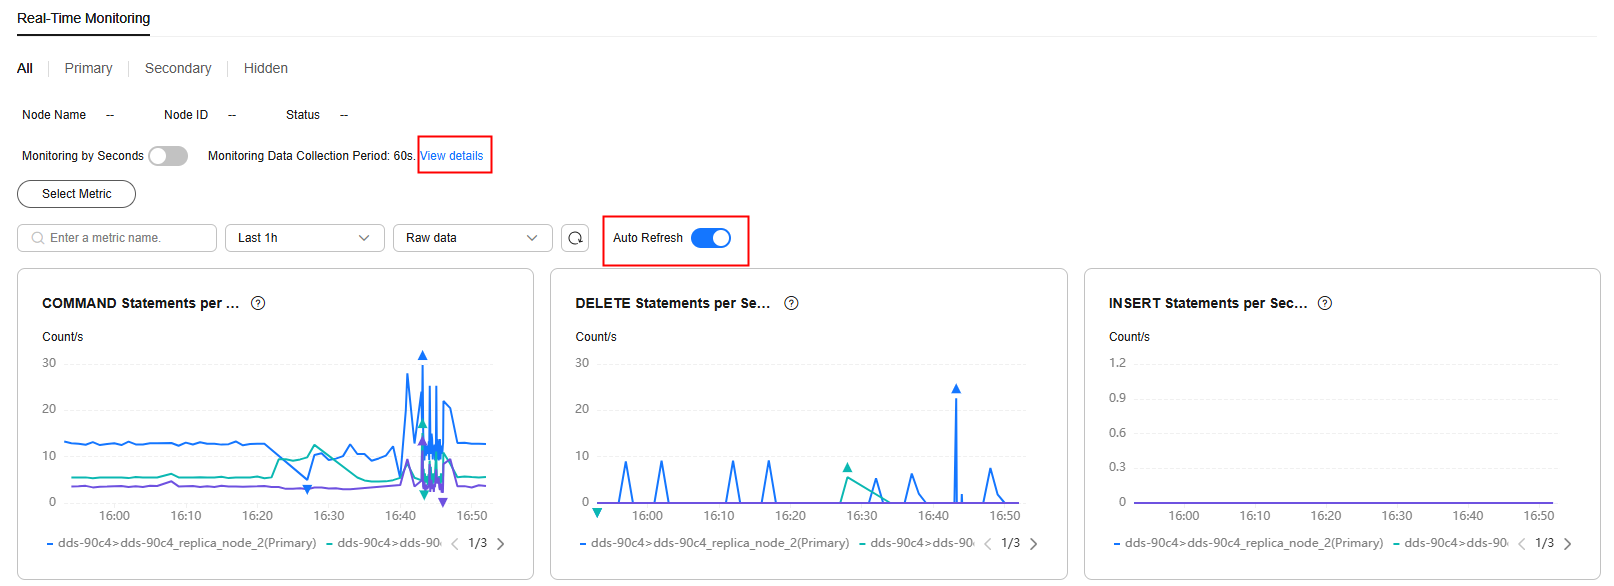
- In the DDS monitoring area, you can select a duration to view the monitoring data. You can view the monitoring data of the last 1 hour, 3 hours, and 12 hours. Figure 4 Enabling Auto Refresh

- If automatic refresh is enabled, monitoring data is automatically refreshed every 30 seconds.
- For more metric information, click View details to switch to the Cloud Eye console.
Feedback
Was this page helpful?
Provide feedbackThank you very much for your feedback. We will continue working to improve the documentation.See the reply and handling status in My Cloud VOC.
For any further questions, feel free to contact us through the chatbot.
Chatbot


