Operations Reports
You can customize operations reports for domain names to view statistics in different time segments, so that you can learn about the domain status and promptly adjust businesses.
Precautions
- You can add up to 100 domain names to a custom operations report.
- In a custom operations report, you can query parameters from the last 90 days. Each query covers up to 31 days.
- The minimum statistical granularity is day.
- The statistical latency and algorithm error may cause the difference between the statistical data and the logged data. The logged data is used.
- You can view the corresponding data only after customizing an operations report. Due to the log integrity latency, a report will be generated on the next day. For example, a report customized on August 2, 2023 will be generated on August 3, 2023.
Procedure
- Log in to the CDN console.
- In the navigation pane, choose .
- By default, CDN provides domain name rankings and region/carrier rankings.
- Domain Rankings: displays domain names by the volume of user visit traffic and origin pull traffic in descending order by default. This report is displayed by default and does not need to be customized.
- You can query data from the last 90 days. Each query covers up to 31 days.
- Regions & Carriers: displays data about regions and carriers of users who access your domain names. This report is displayed by default and does not need to be customized.
- You can filter domain names by service area (All, Chinese mainland, or Outside Chinese mainland).
- You can filter domain names by service type.
- You can filter statistics by tag, HTTP version, and IP version.
- You can filter visitor data by region (global or China). China includes Chinese mainland, Hong Kong, Macao, and Taiwan.
- Data of the past 90 days can be queried, and each query can include data of up to 31 days.
- Domain Rankings: displays domain names by the volume of user visit traffic and origin pull traffic in descending order by default. This report is displayed by default and does not need to be customized.
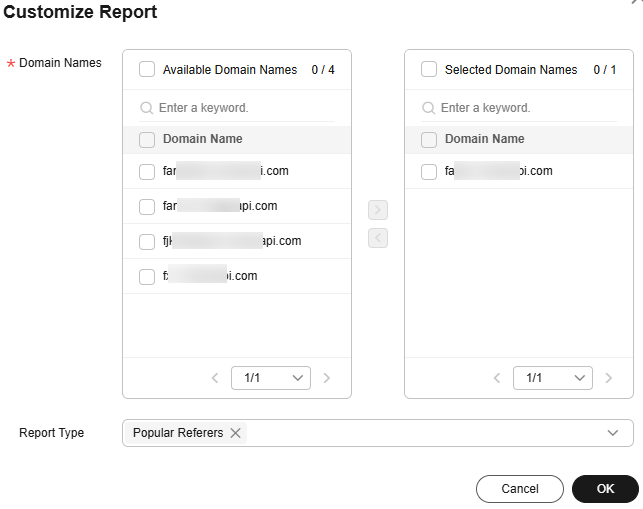
- To customize an operations report, click Customize Report.
Figure 1 Customizing an operations report

Table 1 Parameter description Parameter
Description
Domain Names
Select 1 to 100 domain names.
- Domain names cannot be filtered by enterprise project.
Report Type
- Popular URLs: top 100 URLs sorted by traffic or number of requests
- Popular Referers: top 100 referers sorted by traffic or number of requests
- Popular User Agents: top 100 user agents sorted by traffic or number of requests
- Set required parameters and click OK.
- On the next day, click a tab on the Operations Reports tab to view the corresponding data.
Exporting Reports
You can export custom reports to your device. Click Export on tabs under the Operations Report page to export desired reports in XLSX format.
Feedback
Was this page helpful?
Provide feedbackThank you very much for your feedback. We will continue working to improve the documentation.See the reply and handling status in My Cloud VOC.
For any further questions, feel free to contact us through the chatbot.
Chatbot


