
Help Center/ Huawei Cloud Astro Zero/ User Guide (Low-Code)/ Frontend Development/ Standard Pages/ Debugging Standard Pages
Updated on 2025-11-20 GMT+08:00
Debugging Standard Pages
After developing a standard page, you need to check whether the page meets the expectation. Standard page debugging is classified into event debugging and page style debugging.
Debugging Events
- Open a standard page. Figure 1 Standard page instance

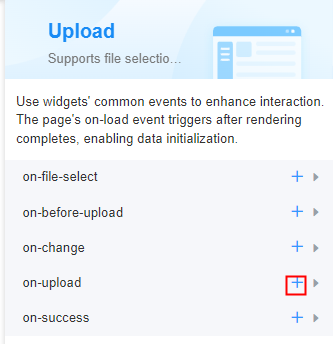
- Select a widget, for example, Upload. In the right pane, switch to the Events tab page and click + next to on-upload. Figure 2 Clicking the plus sign (+) next to on-upload
- In the code editing area, use the debugger statement to set breakpoints and click Create. Figure 3 Using the debugger statement to set breakpoints

- Return to the standard page development page, click
 , save the standard page, and click
  to preview the standard page.
 - On the preview page that is displayed, press F12 or Ctrl + Shift + I to start the debugging tool. View log information on the Console tab page and network request information on the Network tab page.Figure 4 Viewing log information on the Console tab page
 Figure 5 Viewing network request information on the Network tab page
- Click the upload button to upload the file. The debugger statement is used to set a breakpoint in the custom JavaScript code of the uploaded event. Therefore, the event code stops when the debugger statement is executed.
- You can press F8 to go to the next breakpoint or press F10 to go to the next line. Figure 6 Debugging JavaScript code

Debugging the Page Style
- On the standard page development page, click
 to preview the standard page.
 - On the preview page that is displayed, press F12 or Ctrl + Shift + I to start the debugging tool.
- Click the Elements tab and click the selector icon on the left.
- On the preview page, select a widget and debug the style in Styles in the lower right corner. For example, change the font color of Upload File or change the DOM structure. Figure 7 Debugging the DOM structure and style

Feedback
Was this page helpful?
Provide feedbackThank you very much for your feedback. We will continue working to improve the documentation.See the reply and handling status in My Cloud VOC.
The system is busy. Please try again later.
For any further questions, feel free to contact us through the chatbot.
Chatbot


