Checking Event Inspection Data on AOM
AOM periodically inspects application services for which the intelligent insights function has been enabled, monitors service quality based on key metrics (such as the average RT and error rate) of historical data, and enables global analysis of problems.
Description
AOM dynamically determines upper limits based on the historical data of applications and checks whether the recent data is abnormal.
- Dynamically determines upper limits based on the historical 3-hour data of applications and checks whether the data in the last 10 minutes is abnormal. The following event types are supported:
- Service Avg. RT Sharply Increases
- Top N API Avg. RT Sharply Increases
- Service Error Rate Sharply Increases
- Top N API Error Rate Sharply Increases
- Dynamically determines upper limits based on the historical 1-hour data of applications and checks whether the data in the last 15 minutes is abnormal. The following event type is supported: Service Traffic Unbalanced.
Procedure
- Log in to the AOM 2.0 console.
- In the navigation pane, choose Application Monitoring > Intelligent Insights (Beta).
- Set a time range in the upper right corner of the page. You can use a predefined time label, such as Last hour and Last 6 hours, or customize a time range.
- Select a target application from the drop-down list above the filter.
- Filter event inspection data. The Filters area displays the types and statuses of events captured in a specific time range. You can select different filters to view events.
AOM supports filtering by:
- Event Type: types of abnormal events detected during inspection. Options:
- Service Avg. RT Sharply Increases: Based on the historical 3-hour data of applications, AOM determines whether the average RT of the entire service sharply increases in the last 10 minutes.
- Top N API Avg. RT Sharply Increases: By default, the top 5 APIs ranked by traffic are detected. Based on the historical 3-hour data of APIs, AOM determines whether the average RT of the top 5 APIs sharply increases in the last 10 minutes.
- Service Error Rate Sharply Increases: Based on the historical 3-hour data of applications, AOM determines whether the error rate of the entire service sharply increases in the last 10 minutes.
- Top N API Error Rate Sharply Increases: By default, top 5 APIs ranked by traffic are detected. Based on the historical 3-hour data of APIs, AOM determines whether the error rate of the top 5 APIs sharply increases in the last 10 minutes.
- Service Traffic Unbalanced: Based on the historical 1-hour data of applications, AOM checks whether the traffic of all instances in the last 15 minutes is unbalanced.
- Status: status of events detected during inspection.
- In progress: indicates that an abnormal event is happening.
- Completed: indicates that an abnormal event has completed.
- Event Type: types of abnormal events detected during inspection. Options:
- Check the event overview, card (list), and details.
- Checking the event overview
On the Intelligent Insights (Beta) page, events in the last 30 minutes are displayed in a bar graph by default. You can adjust the time range as required to view events in the last hour, last 6 hours, last day, last week, or a custom time range.
Figure 1 Event statistics view
In the graph area, perform the following operations if needed:
- In the upper left corner of the graph, view the total number of abnormal events detected during inspection in the specified period.
- Move the pointer to the bar graph to view the number of events of each type at a specific time point.
- Click a legend above the bar graph to hide or display a certain type of events.
- In the search box, enter a keyword to filter events.
- Checking the event card (list)
The event card (list) displays the abnormal events detected during inspection in a specified time range. You can click
 in the upper right corner of the page to switch the event display mode (card or list). Each event contains the following information:
- Event Type: type of an event.
- Description: describes the component and interface where the event occurs.
- Triggered: time when an exception first occurs.
- Duration: the period for which the exception lasts.
Figure 2 Event cards Figure 3 Event list
- Checking event details
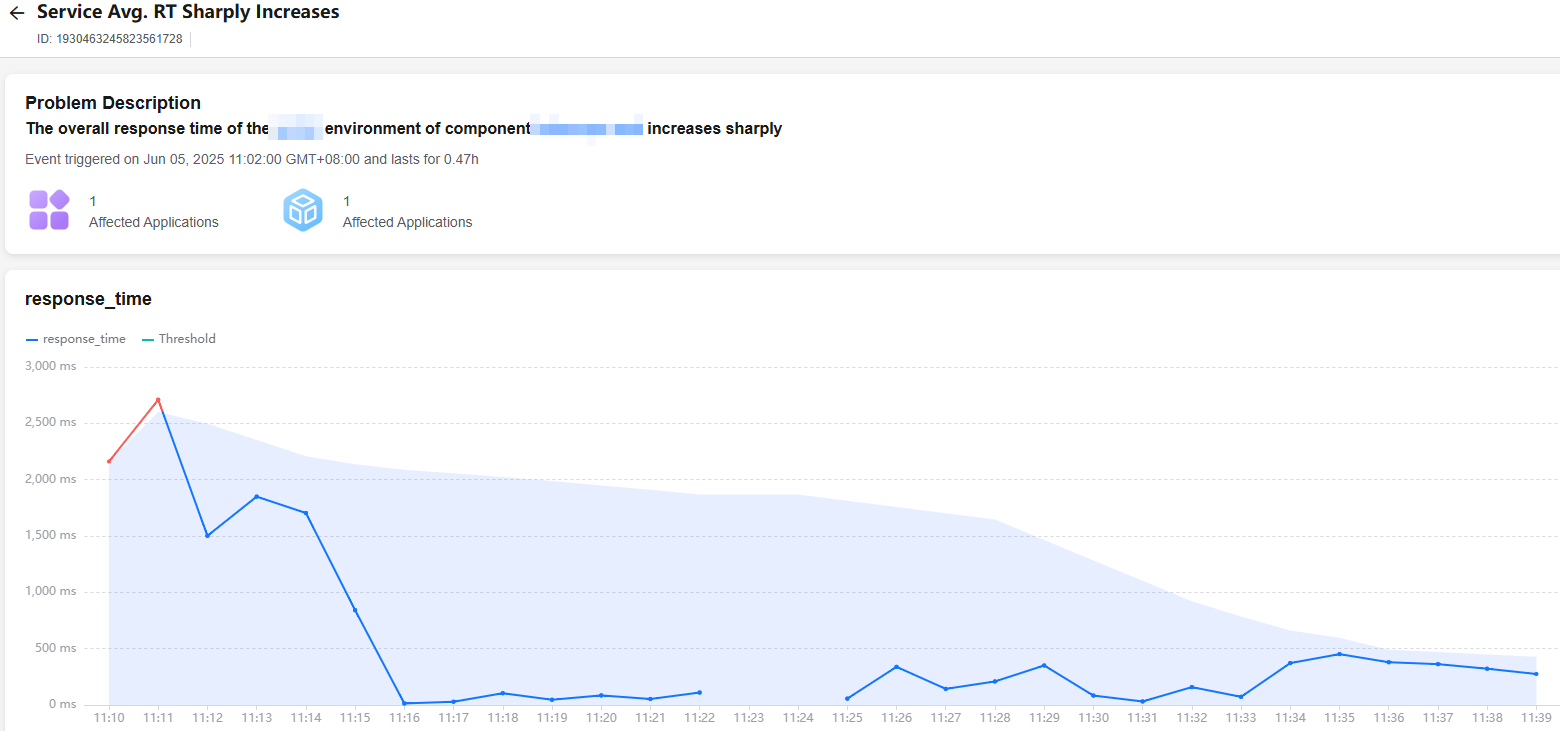
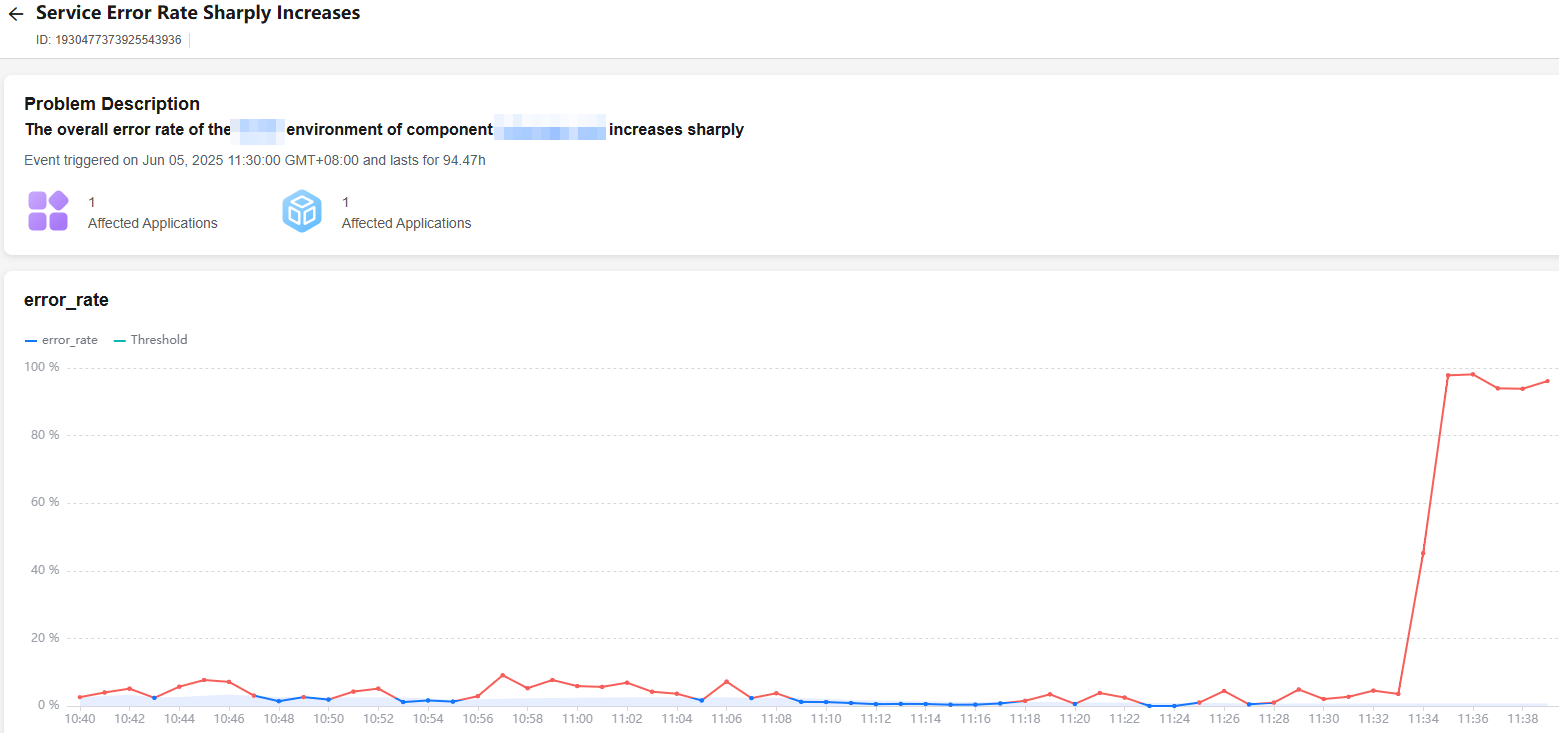
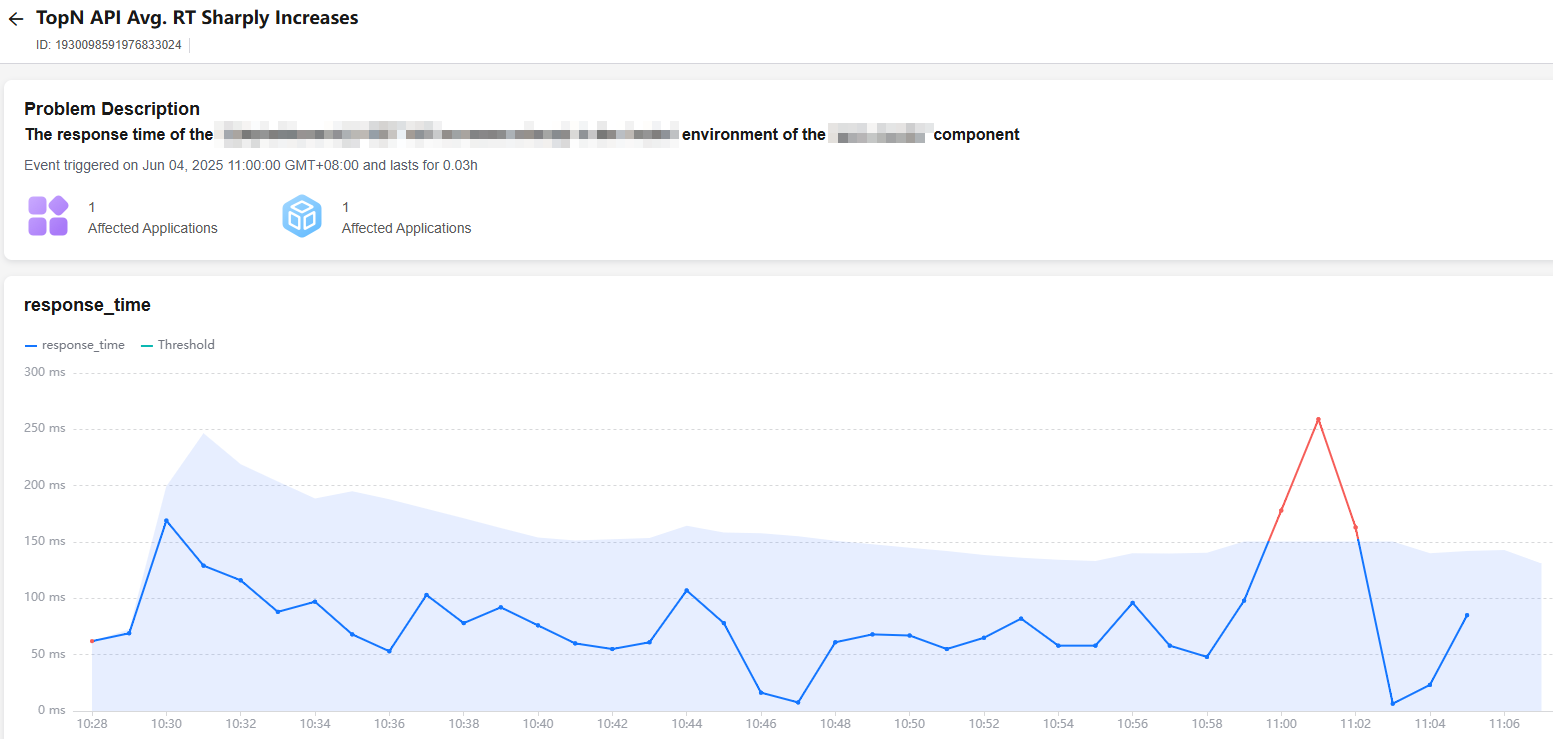
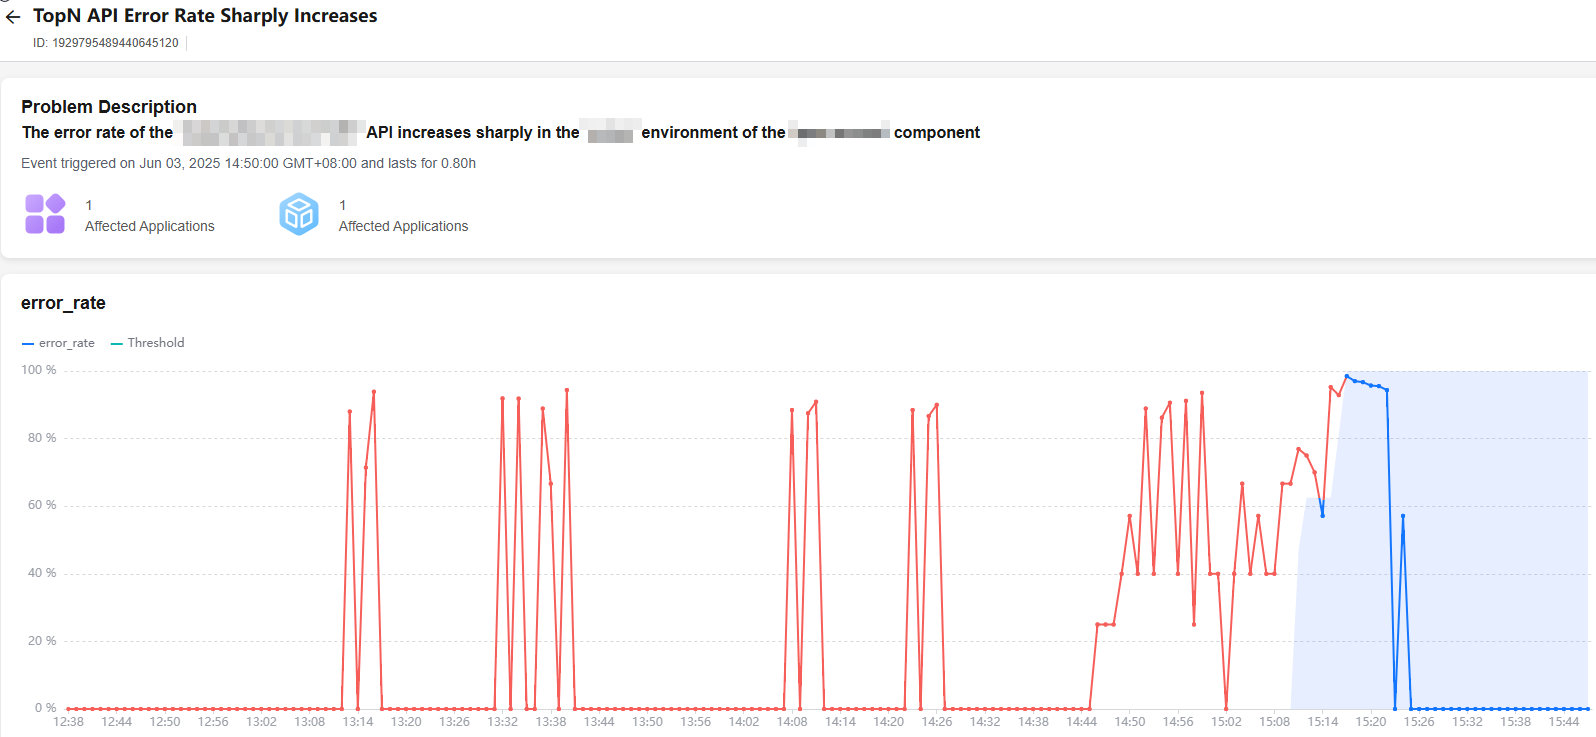
You can click different event cards or lists to go to the event details page. On the event details page, graphs about key metrics such as RT and error rate are displayed, showing the duration for which an exception lasts, time when the exception first occurs, and upper limit. (You can click the component, environment, or API name under Problem Description on the event details page to go to the corresponding details page. Currently, redirection is supported only in AP-Singapore.)
- Details displayed when the service avg. RT sharply increases:
Figure 4 Service avg. RT sharply increases
- Details displayed when the service error rate sharply increases:
Figure 5 Service error rate sharply increases
- Details displayed when the top N API avg. RT sharply increases:
Figure 6 Top N API avg. RT sharply increases
- Details displayed when the top N API error rate sharply increases:
Figure 7 Top N API error rate sharply increases
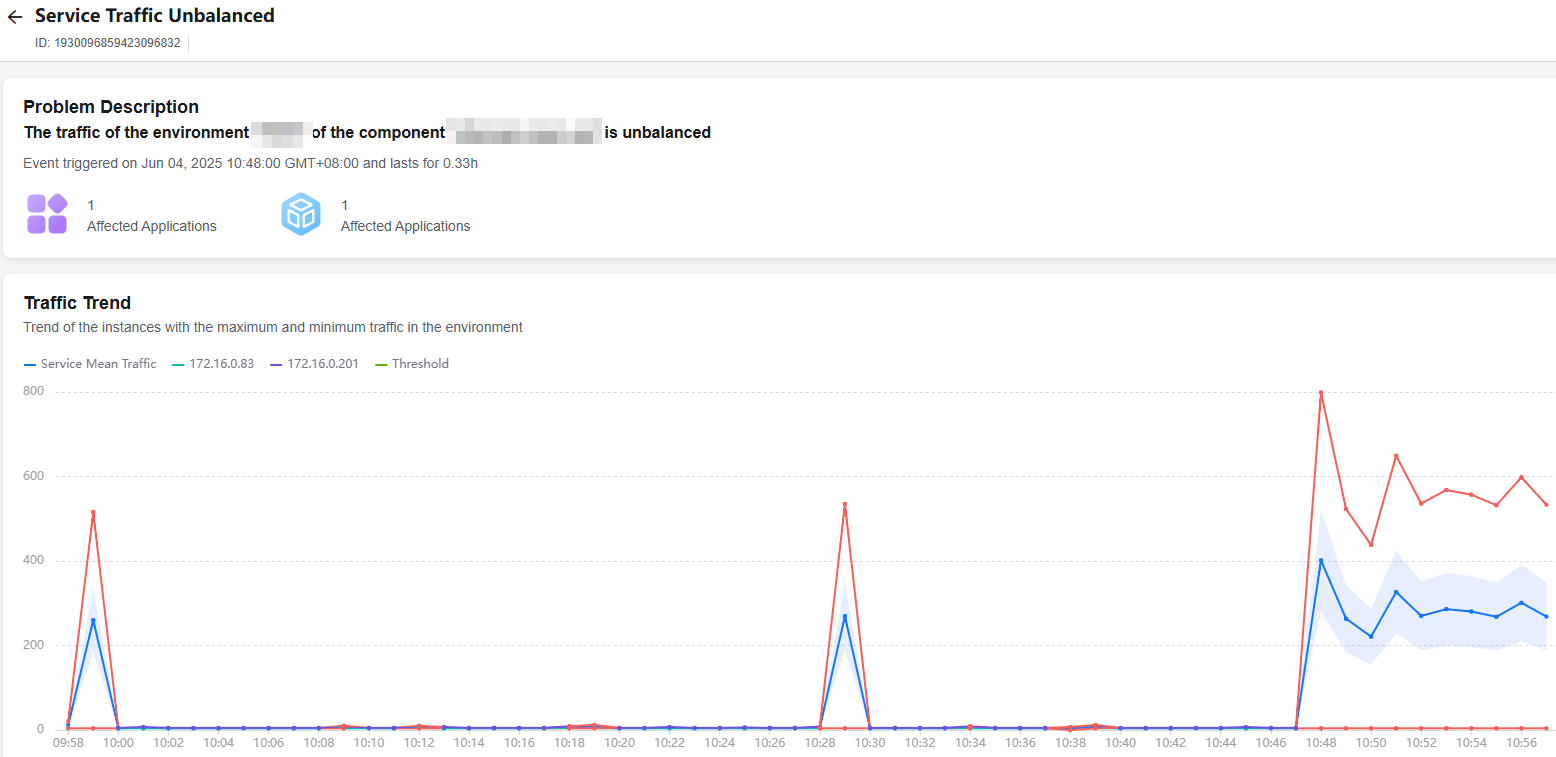
- Details displayed when the service traffic unbalanced:
Figure 8 Service traffic unbalanced
- Details displayed when the service avg. RT sharply increases:
- Checking the event overview
Feedback
Was this page helpful?
Provide feedbackThank you very much for your feedback. We will continue working to improve the documentation.See the reply and handling status in My Cloud VOC.
For any further questions, feel free to contact us through the chatbot.
Chatbot


