Configuring Recording Rules to Improve Metric Query Efficiency
Recording rules can be used for secondary development of metric data. By setting recording rules, you can move the computing process to the write end, reducing resource usage on the query end.
Scenario
Some metrics may require much calculation on the query end, affecting query performance. You can configure recording rules to calculate common or complex metrics in advance. Especially in large-scale clusters and complex service scenarios, recording rules can reduce PromQL complexity, improve metric query performance, and prevent slow configuration and query.
Prerequisite
- Both your service and CCE cluster have been connected to a Prometheus instance for CCE. For details, see Using Prometheus Monitoring to Monitor CCE Cluster Metrics.
- Your service has been connected to a common Prometheus instance. For details, see Managing Prometheus Instances.
Configuring a Recording Rule
- Log in to the AOM 2.0 console.
- In the navigation pane on the left, choose Prometheus Monitoring > Instances.
- In the instance list, click a Prometheus instance for CCE or a common Prometheus instance.
- In the navigation pane on the left, choose Settings. In the Recording Rules area, click Edit RecordingRule.yaml.
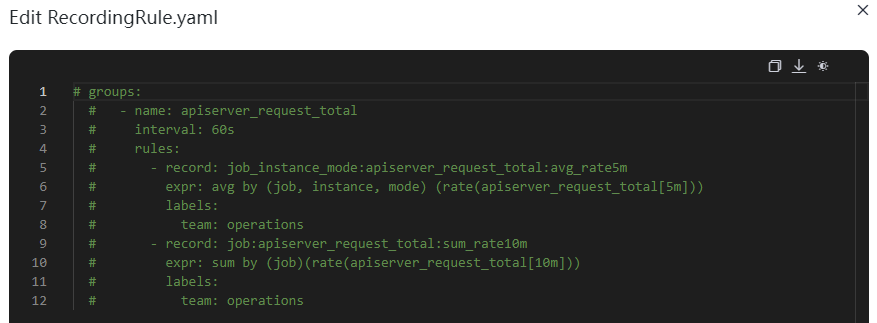
- In the dialog box that is displayed, delete the default content and enter a custom recording rule.
Only one RecordingRule.yaml file needs to be configured for a cluster. Each rule group name must be unique.Figure 1 Configuring a recording rule

Table 1 Recording rule parameters Parameter
Description
groups
Rule group. You can set multiple rule groups in one RecordingRule.yaml file.
name
Rule group name. Each rule group name must be unique.
interval
Execution interval of a rule group. The default value is 60s. (Optional)
rules
Rule. A rule group can contain multiple rules.
record
Name of a rule. The name must comply with Prometheus metric name specifications.
expr
Calculation expression. It is used to calculate metric values. It must comply with PromQL requirements.
labels
Metric label. Labels must comply with Prometheus metric label specifications. (Optional)
Example of a recording rule:
groups: - name: apiserver_request_total interval: 60s rules: - record: apiserver_request_rate expr: avg by (job, instance, mode) (rate(apiserver_request_total[5m])) labels: team: operations - record: job:apiserver_request_total:sum_rate10m expr: sum by (job)(rate(apiserver_request_total[10m])) labels: team: operations - Click OK.
After the recording rule is configured, you can view metrics through:
- Metric Browsing page
- Grafana
Feedback
Was this page helpful?
Provide feedbackThank you very much for your feedback. We will continue working to improve the documentation.See the reply and handling status in My Cloud VOC.
For any further questions, feel free to contact us through the chatbot.
Chatbot


