Viewing Server Alarms
HSS displays alarm and event statistics and their summary all on one page. You can have a quick overview of alarms, including the numbers of urgent alarms, total alarms, servers with alarms, blocked IP addresses, and isolated files.
The Events page displays the alarm events generated in the last 30 days. You can manually handle the alarmed items.
The status of a handled event changes from Unhandled to Handled.
Constraints
- To skip the checks on high-risk command execution, privilege escalations, reverse shells, abnormal shells, or web shells, manually disable the corresponding policies in the policy groups on the Policies page. HSS will not check the servers associated with disabled policies. For details, see Viewing a Policy Group.
- Other detection items cannot be manually disabled.
- Servers that are not protected by HSS do not support operations related to alarms and events.
Viewing Server Alarms
- Log in to the HSS console.Log in to the management console.
- Click
 in the upper left corner and select a region or project.
 - In the navigation pane on the left, choose Detection & Response > Alarms and click Server Alarms.
- (Optional) If you have enabled the enterprise project function, select an enterprise project from the Enterprise Project drop-down list in the upper part of the page to view its data.
- Check server alarms.
Table 1 Alarm statistics Parameter
Description
Enterprise Project
Select an enterprise project and view alarm details by enterprise project.
Time range
You can select a fixed period or customize a time range to search for alarms. Only alarms generated within 30 days can be queried.
The options are as follows:
- Last 24 hours
- Last 3 days
- Last 7 days
- Last 30 days
Urgent Alarms / Total
Number of alarms to be handled and total number of alarms. You can click a number to view the alarm list.
Auto Blocked / Handled Alarms
Number of blocked alarms and number of handled alarms. Click a number to view the alarm list.
Affected Servers
Number of servers that trigger alarms. You can click a number to go to the Servers & Quota page and view the server list.
When checking alarms generated in the last 24 hours, you can click the number of servers to go to the Servers & Quota page and check the corresponding servers.
Blocked IP Addresses
Number of blocked brute-force attack IP addresses.
You can click the number to check blocked IP address list. The blocked IP address list displays the server name, attack source IP address, login type, blocking status, number of blocks, blocking start time, and the latest blocking time.
If a valid IP address is blocked by mistake (for example, after O&M personnel enter incorrect passwords for multiple times), you can manually unblock it. If a server is frequently attacked, you are advised to fix its vulnerabilities in a timely manner and eliminate risks.
Notes:
- The agent of Linux 3.2.10 or later supports IPv6 blocking. The agent of any earlier version can use TCP Wrapper for blocking, but cannot use iptables for IPv6 blocking.
- After a blocked IP address is unblocked, HSS will no longer block the operations performed by the IP address.
- A maximum of 10,000 IP addresses can be blocked for each type of software.
If your Linux server does not support ipset, a maximum of 50 IP addresses can be blocked for MySQL and vsftp.
If your Linux server does not support ipset or hosts.deny, a maximum of 50 IP addresses can be blocked for SSH.
Isolated Files
HSS can isolate detected threat files. Files that have been isolated are displayed on a slide-out panel on the Server Alarms page. You can click Isolated Files on the upper right corner to check them.
You can recover isolated files. For details, see Managing Isolated Files.
You can click the number under Isolated Files to check the files.
- Viewing the alarms of a certain type or ATT&CK phase
In the Alarms to Be Handled area, you can select an alarm type and an ATT&CK phase to view the alarms of the selected type. For details, see ATT&CK attack phase description.

Adversarial Tactics, Techniques and Common Knowledge (ATT&CK) is a framework that helps organizations understand the cyber adversary tactics and techniques used by threat actors across the entire attack lifecycle.
Table 2 ATT&CK phases ATT&CK Phase
Description
Reconnaissance
Attackers seek vulnerabilities in your system or network.
Initial Access
Attacker try to enter your system or network.
Execution
Attackers try to run malicious code.
Persistence
Attackers try to maintain their foothold.
Privilege Escalation
Attackers try to obtain higher permissions.
Defense Evasion
Attackers try to avoid being detected.
Credential Access
Attackers try to steal account names and passwords.
Command and Control
Attackers try to communicate with compromised machines to control them.
Impact
Attackers try to manipulate, interrupt, or destroy your system or data.
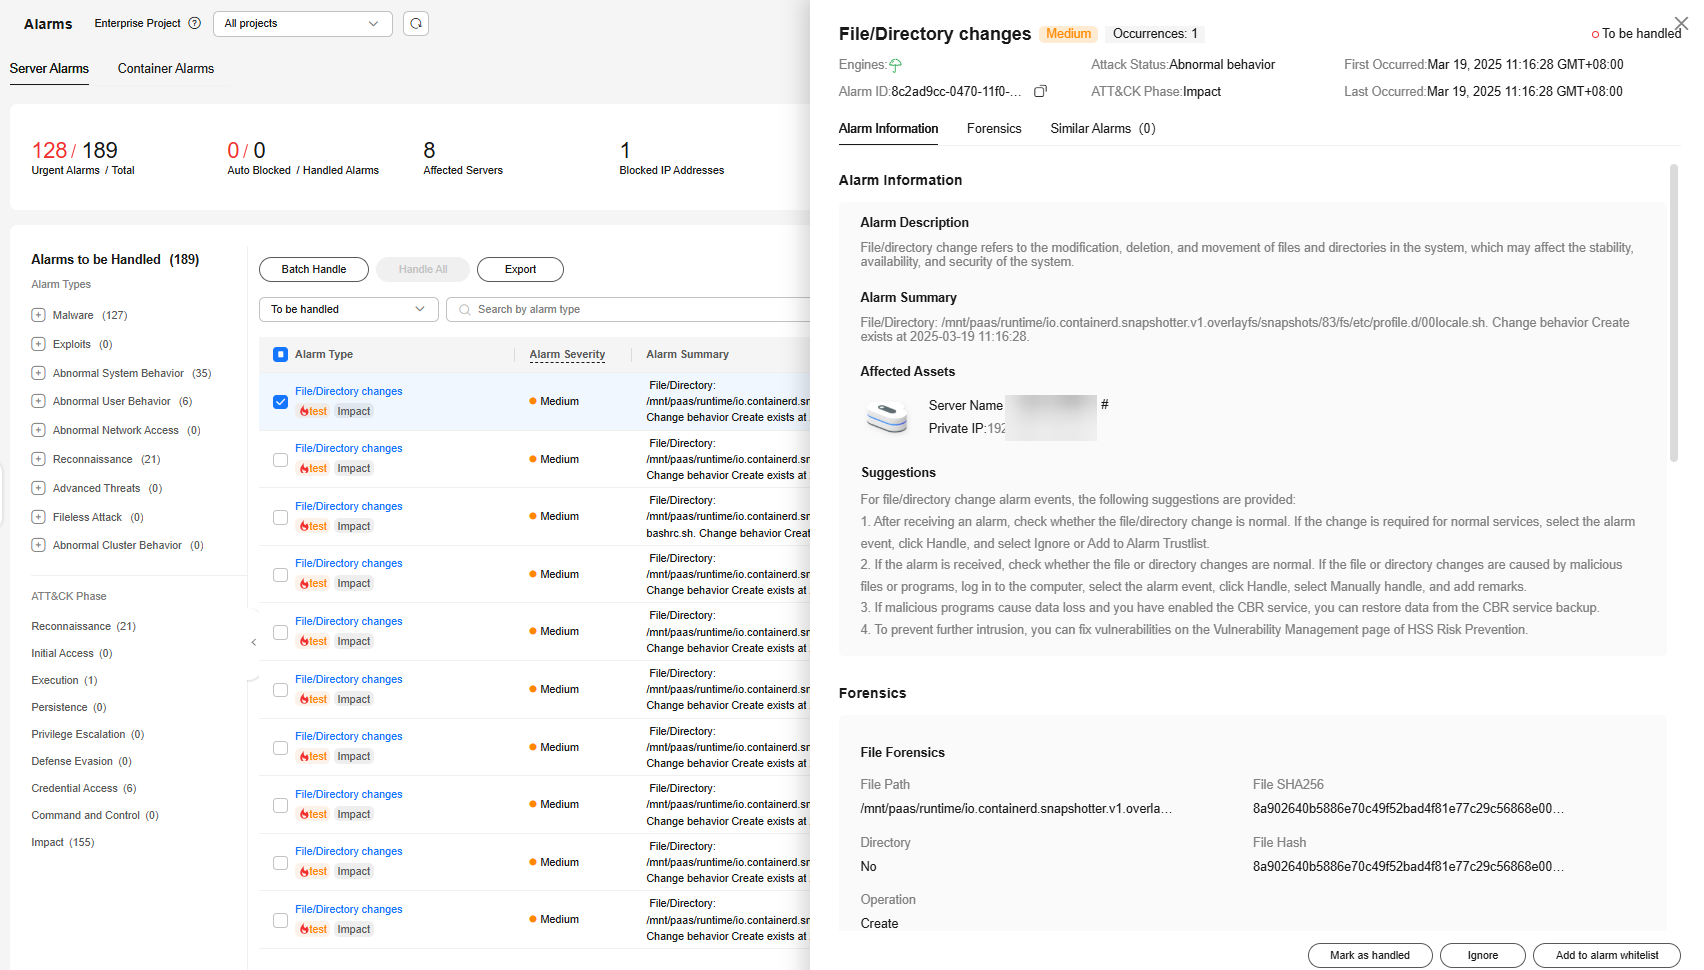
- Viewing the details of a server alarmYou can click the alarm name of an event to view the alarm details. Table 3 describes the alarm parameters.

- For some HSS alarms that have been determined as malware alarms, the alarm source files are saved in the cloud center and you can download them. You can download the alarm source files to your local PC for analysis. The password for decompressing the files is unlock.
- For unacknowledged malware alarms, alarm source files cannot be downloaded. Check the actual service conditions and determine whether the files are malicious files.
Figure 1 Alarm details
Table 3 Alarm detail parameters Parameter
Description
Protection Engine
Detection engines used by HSS, including the virus detection engine, AI detection engine, and malicious intelligence detection engine.
Attack Status
Status of the current threat.
First Occurred
Time when an attack alarm was first generated
Alarm ID
Unique ID of an alarm
ATT&CK Phase
For details about the attack technology models used by attackers in each phase, see Table 2.
Last Occurred
Time when an attack alarm was last generated
Alarm Information
Detailed information about an alarm, including the alarm description, alarm summary, affected assets, and handling suggestions.
Forensics
HSS investigates information such as the attack triggering path or virus type based on the alarm type, helping you quickly trace and locate the attack source.
- Process Tree: If an alarm event contains process information, you can check the process ID, process file path, process command line, process startup time, and process file hash on the Forensics tab page. You can locate malicious processes based on such information.
- File Forensics: If an alarm event contains file information, the file forensics information is displayed on the Forensics tab page. File forensics information includes the file path, file hash, file operation type, and user information (which may not be obtained by instantaneous processes). You can locate a file based on the information.
- Network Forensics: If an alarm event contains file information, the network forensics information is displayed on the Forensics tab page. Network forensics information includes the local IP address, local port, remote IP address, remote port, and protocol. You can determine whether the access is unauthorized based on such information.
- User Forensics: If an alarm event contains user behavior information, the user forensics information is displayed on the Forensics tab page. User forensics information includes the username, login IP address, login service type, login service port, last login event, and number of login failures. You can determine whether the access is unauthorized based on such information.
- Registry Forensics: If an alarm event contains registry information, you can check the registry keys and values on the Forensics tab page. You can locate registry risks based on such information.
- Abnormal Login Forensics: If an alarm event contains abnormal login information, you can check the login IP address and port number on the Forensics tab page. You can determine whether the login is trusted based on such information.
- Malware Forensics: If an alarm event contains malware information, you can check the malware family, virus name, virus type, and confidence level on the Forensics tab page.
- Auto-started Item Forensics: If an alarm event contains self-startup item information, you can check the user, command, self-startup item information, and process file command line information on the Forensics tab page. You can locate the auto-boot item based on the auto-started item forensics information.
- Kernel Forensics: If an alarm event contains kernel information, you can check system functions and kernel functions on the Forensics tab page. You can locate kernel risks based on the information.
Similar Alarms
Alarm whose server and event type are the same as those of this alarm. You can handle the alarm according to the handling method of the similar alarms.
FAQ
- Why are there multiple similar alarms?
If similar events that occur within 24 hours, HSS combines them into one alarm. If similar events occur at an interval of 24 hours or more, HSS reports them as independent alarms. Therefore, you can see multiple similar alarms.
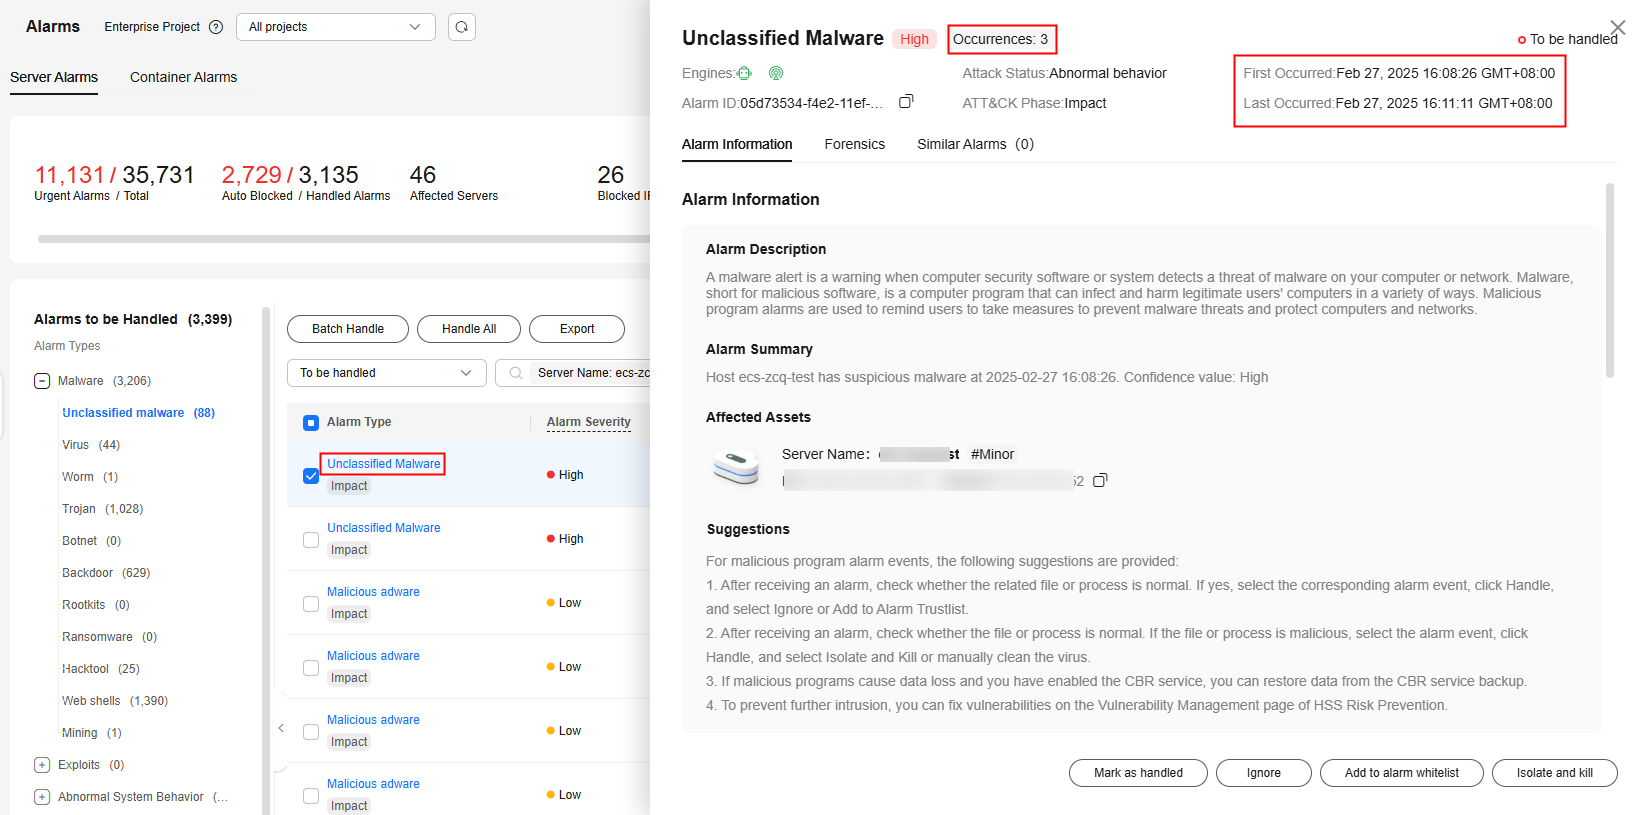
- How do I check the number of similar alarms that occurred within 24 hours?
Click an alarm name to view the number of occurrences, first occurrence time, and latest occurrence time on the alarm details page.
Figure 2 Alarm details
Feedback
Was this page helpful?
Provide feedbackThank you very much for your feedback. We will continue working to improve the documentation.


