

Help Center/ Elastic Load Balance/ User Guide/ User Guide for Shared Load Balancers/ Cloud Eye Monitoring/ Viewing Traffic Usage
Updated on 2026-07-09 GMT+08:00
Viewing Traffic Usage
Scenarios
For livestreaming platforms, traffic often increases suddenly, which makes the services unstable. To address this issue, most of them use ELB to distribute traffic. By working with Cloud Eye, ELB allows you to monitor the traffic usage in real time. You can view the traffic consumed by the EIPs bound to public network load balancers to better balance your application workloads.
Prerequisites
- Load balancers are running properly.
- If the associated backend server is stopped, faulty, or deleted, its metrics cannot be viewed on Cloud Eye. After such a backend server restarts or recovers, its monitoring data will be displayed on the Cloud Eye console.
Viewing Traffic Usage of the Bound EIP
- Go to the EIP list page.
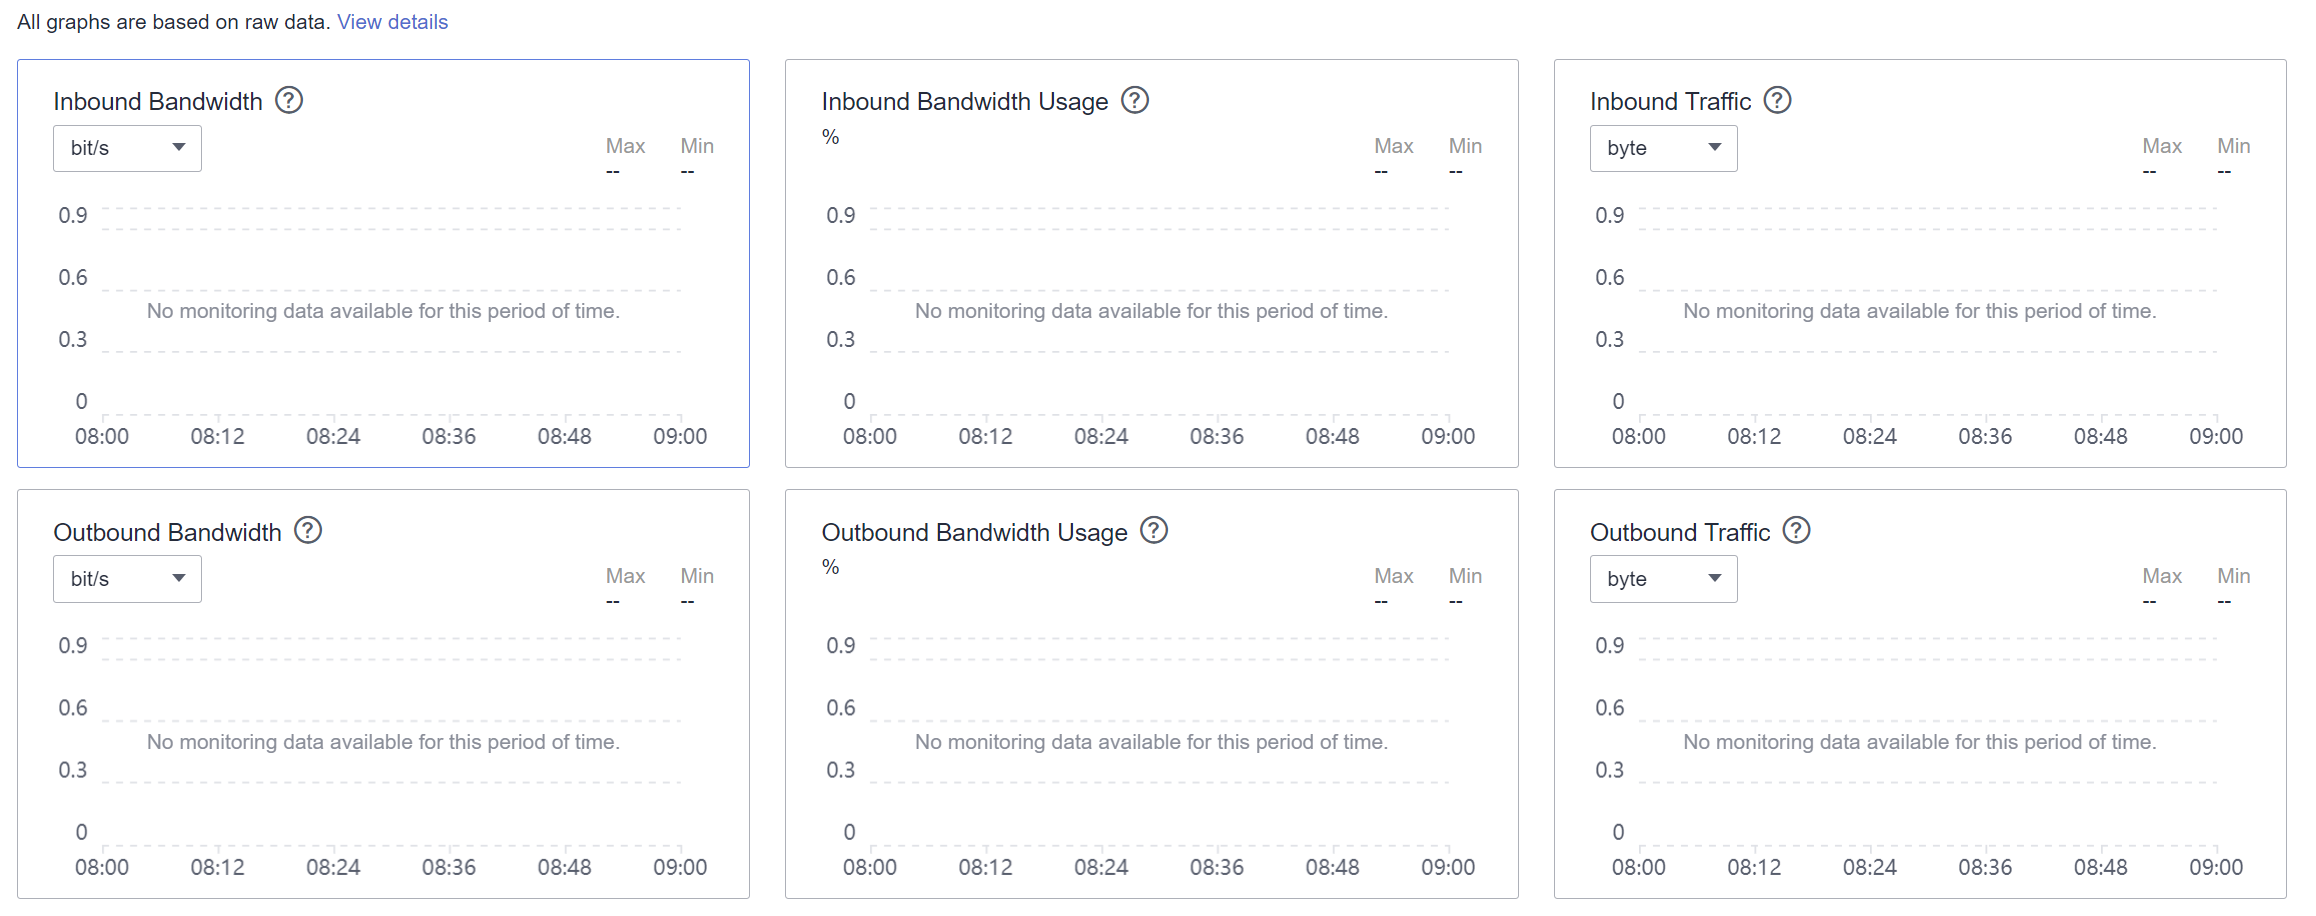
- Locate the EIP bound to the load balancer and click its name. On the Bandwidth tab, you can view the data for the last 1, 3, 12 hours, last day, or last 7 days. For more monitoring metrics supported by EIP, see EIP Monitoring Metrics. Figure 1 EIP traffic usage
Viewing Load Balancer Traffic Metrics
- Go to the load balancer list page.
- On the load balancer list page, locate the load balancer and click its name.
- Click the Monitoring tab, select Load balancer for Dimension, and view the graphs of inbound and outbound rates.
What is your overall rating for this page?
0
1
2
3
4
5
6
7
8
9
10
Very dissatisfiedVery satisfied
Thank you very much for your feedback. We will continue working to improve the documentation.
The system is busy. Please try again later.


