Viewing Monitoring Data
Scenario
Cloud Eye monitors event channel metrics in real time. You can view these metrics on the Cloud Eye console.
Prerequisites
You have created an event channel.
Procedure
- Log in to the EG console.
- Choose Event Channels.
- Click
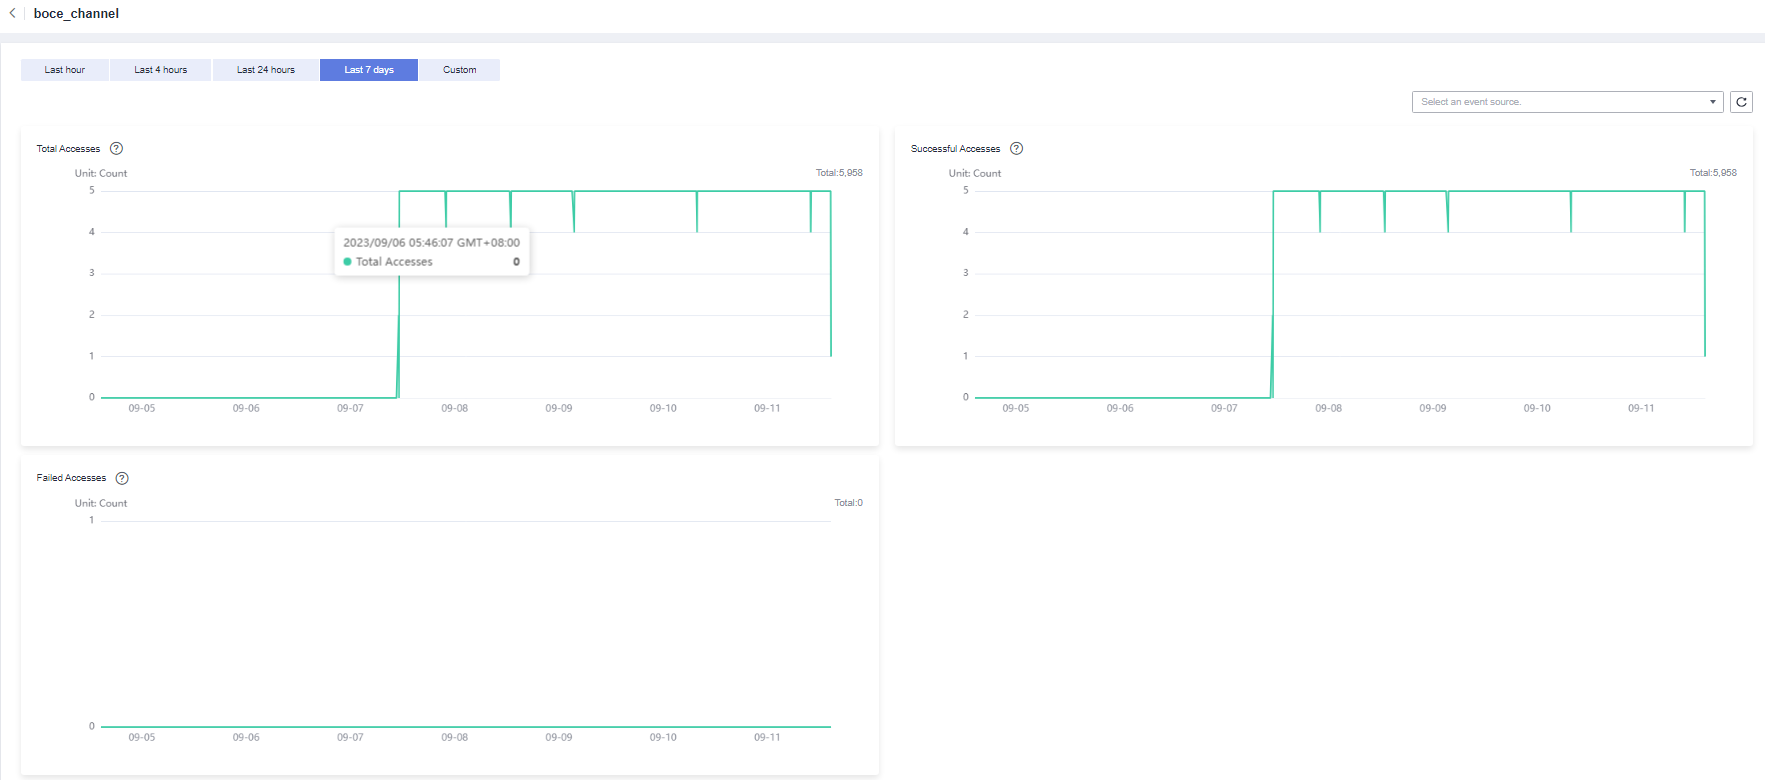
 in the row that contains the target event channel to go to the monitoring page. Data of all accessed events in the last hour is displayed by default.
You can also click 1h, 3h, 12h, 1d, 7d, or 30d to view event accesses in different periods.
Figure 1 Viewing event channel monitoring data

To customize a time range, click
 .
.If you enable Auto Refresh, the metric data is refreshed every 5 seconds.
Click View details to go to the Cloud Eye console.
If you set Period to Raw data, the raw monitoring data is displayed. If you set Period to a specific time, you can select different aggregation methods, including Avg., Max., Min., Sum, and Variance.
Feedback
Was this page helpful?
Provide feedbackThank you very much for your feedback. We will continue working to improve the documentation.


