
Help Center/ Cloud Search Service/ User Guide/ Elasticsearch/ Elasticsearch Cluster Monitoring and Log Management/ Configuring Elasticsearch Cluster Monitoring/ Using Cloud Eye to Monitor Elasticsearch Clusters
Updated on 2025-12-26 GMT+08:00
Using Cloud Eye to Monitor Elasticsearch Clusters
With CSS, you can use Cloud Eye to monitor created clusters. After configuring cluster monitoring, you can log in to the Cloud Eye management console to view cluster metrics.
The procedure for configuring cluster monitoring:
- Creating Alarm Rules: Customize alarm rules for the monitoring metrics. Once a metric exceeds the threshold, the system will notify you by sending emails or HTTP/HTTPS requests.
- Configuring Monitoring Metrics: Configure monitoring metrics for a cluster or a node in the cluster.
- Viewing Cluster Monitoring Information: View the statistics of the monitoring metrics in specific periods.
Recommended Monitoring Metrics
- For routine monitoring of a cluster, you are advised to focus on disk usage and cluster health status.
- Cluster CPU and JVM usage. You are advised to configure the following monitoring metrics: average JVM heap usage, maximum JVM heap usage, average CPU usage, and maximum CPU usage.
- Cluster write and search latency and throughput. You are advised to configure the following monitoring metrics: average index latency, average index rate, average search latency, and average QPS.
- Cluster write and query queue and rejected tasks. You are advised to configure the following monitoring metrics: tasks in write queue, tasks in search queue, rejected tasks in write queue, and rejected tasks in search queue.
Prerequisites
- The cluster is in the Available or Processing state.
- The cluster has been running properly for more than 10 minutes.
Creating Alarm Rules
- Log in to the Cloud Eye console.
- In the navigation pane on the left, choose Alarm Management > Alarm Rules.
- In the Resource Type column, select Cloud Search Service to filter alarm rules.
If no alarm rules are available, create one by referring to Creating an Alarm Rule. Table 1 describes the key parameters. For more parameters, customize them as needed.
Table 1 Alarm rule configuration parameters Parameter
Description
Alarm Type
Select Metric.
Cloud Service
Select Cloud Search Service.
Resource Layer
Select the layer by which you are going to configure alarm rules.
- CSS Clusters: Alarm rules are specified by cluster.
- CSS Clusters - CSS Instances: Configure alarm rules by cluster node.
Configuring Monitoring Metrics
- Create a monitoring dashboard by referring to Creating a Dashboard. If an available monitoring dashboard has been created, skip this step.
- Add CSS monitoring graphs by referring to Adding a Graph.
Viewing Cluster Monitoring Information
In the cluster list, check the monitoring information of clusters and cluster nodes.
- Log in to the CSS management console.
- In the navigation pane on the left, choose Clusters > Elasticsearch.
- In the cluster list, find the target cluster, and choose More > Monitoring Metrics in the Operation column.
- On the Monitoring Metrics page, check the cluster and node metrics. Figure 1 Monitoring Metrics
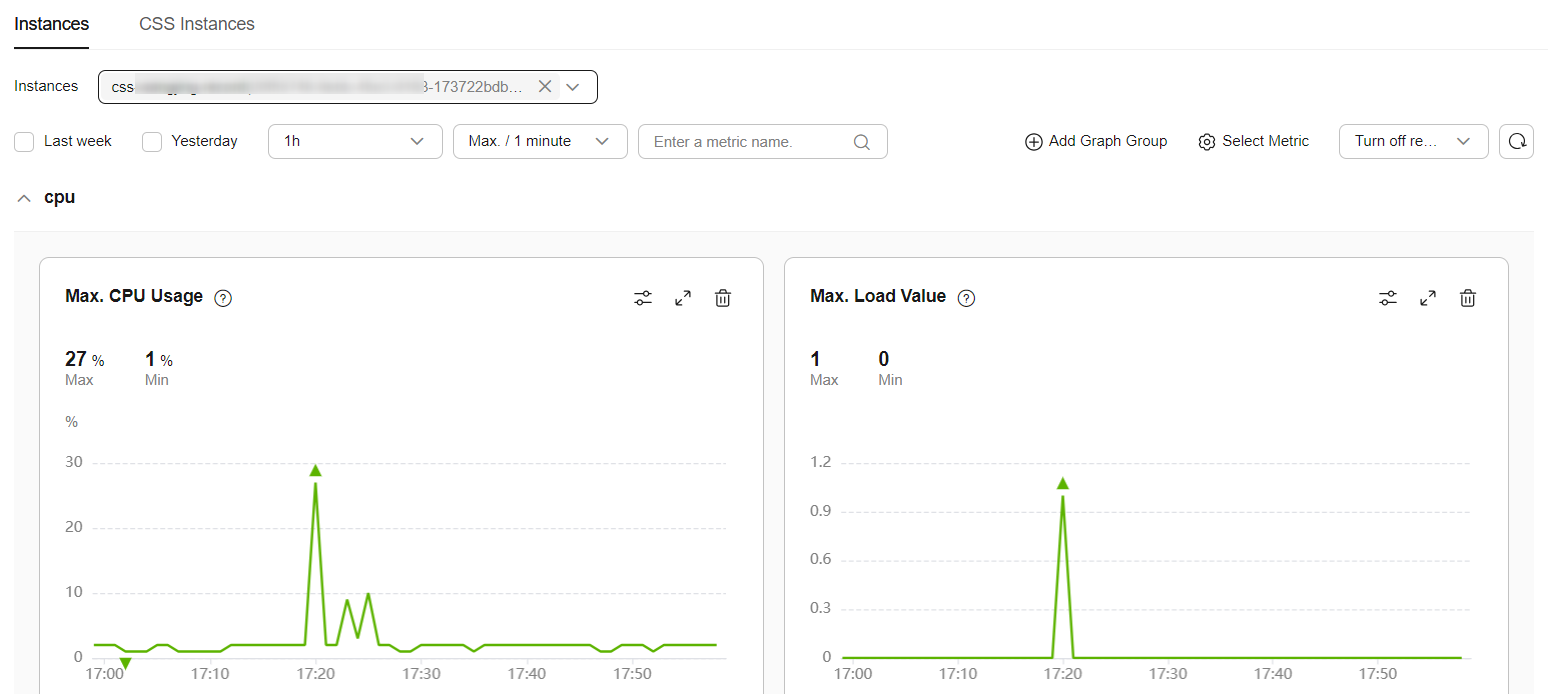
- Click the Instances tab to check cluster metrics.
- Instances: Select a cluster to check its metrics. The current cluster is selected by default. Multiple clusters can be selected so that you may compare between them.
- You can also set monitoring periods so that you can compare metrics between different periods for the same cluster.
- Add Graph Group: You can add a custom group in addition to the default group. When you move the pointer over a group name on the left, the icons for changing the group name and deleting the group are displayed on the right. You can modify the group.
- Select Metric: In the displayed Select Metric dialog box, set All Metrics and Top N Metrics.
- Click the CSS Instances tab to check the metrics of cluster nodes. Only the node monitoring information of the first cluster selected on the Instances tab is displayed.
- CSS Instances: Select the cluster nodes whose metrics and information you want to check. By default, the first node of the current cluster is selected. Multiple nodes can be selected so that you may compare between them.
- You can also set monitoring periods so that you can compare metrics between different periods for the same cluster.
- Add Graph Group: You can add a custom group in addition to the default group. When you move the pointer over a group name on the left, the icons for changing the group name and deleting the group are displayed on the right. You can modify the group.
- Select Metric: In the displayed Select Metric dialog box, set All Metrics.
- Click the Instances tab to check cluster metrics.
Parent topic: Configuring Elasticsearch Cluster Monitoring
Feedback
Was this page helpful?
Provide feedbackThank you very much for your feedback. We will continue working to improve the documentation.
The system is busy. Please try again later.


