
Viewing Network Traffic Analysis
You can view details about the inbound and outbound traffic and attack trend on cloud servers in real time to check for abnormal traffic.
Viewing Inbound Traffic
- Log in to the management console.
- Click
 in the upper left corner of the management console and select a region or project.
 - In the navigation pane, click
 and choose . The Dashboard page will be displayed, as shown in Figure 1.
- (Optional) If the current account has only one firewall instance, the firewall details page is displayed. If there are multiple firewall instances, click View in the Operation column to go to the details page.
- In the navigation pane, choose .
- View the statistics on the traffic passing through the firewall. You can select the query duration from the drop-down list.
- Traffic Dashboard: Information about the highest traffic from the Internet to internal servers.
- Inbound Traffic: Inbound request and response traffic.
- Visualizations: Top 5 items ranked by certain parameters regarding inbound traffic within a specified time range. For more information, see Table 1. Click a record to view the traffic details.
Table 1 Inbound traffic parameters Parameter
Description
Top Access Source IP Addresses
Source IP addresses of inbound traffic.
Top Access Source Regions
Geographical locations of the source IP addresses of inbound traffic.
Top Destination IP Addresses
Destination IP addresses of inbound traffic.
Top Open Ports
Destination ports of inbound traffic.
Application Distribution
Application information about inbound traffic.
- IP analysis: Top 50 traffic records in a specified period.
- EIPs: Traffic information about destination IP addresses.
- Source IP Addresses: Traffic information about source IP addresses.
Viewing Outbound Traffic
- Log in to the management console.
- Click in the upper left corner of the management console and select a region or project.
- In the navigation pane, click and choose . The Dashboard page will be displayed, as shown in Figure 2.
- (Optional) If the current account has only one firewall instance, the firewall details page is displayed. If there are multiple firewall instances, click View in the Operation column to go to the details page.
- In the navigation pane, choose .
- View the statistics on the traffic passing through the firewall. You can select the query duration from the drop-down list.
- Traffic Dashboard: Information about the highest traffic when internal servers access the Internet.
- Outbound Traffic: Outbound request and response traffic.
- Visualizations: Top 5 items ranked by certain parameters regarding outbound traffic within a specified time range. For more information, see Table 2. Click a record to view the traffic details.
Table 2 Outbound traffic parameters Parameter
Description
Top Destination IP Addresses
Destination IP addresses of outbound traffic.
Top Destination Regions
Geographical locations of the source IP addresses of outbound traffic.
Top Access Source IP Addresses
Source IP addresses of outbound traffic.
Top Open Ports
Destination ports of outbound traffic.
Application Distribution
Application information about outbound traffic.
- IP analysis: Top 50 traffic records in a specified period.
- External IP Address: Traffic information about the destination IP address.
- Assets Initiating Internet Connections: Traffic information whose source IP addresses are public IP addresses.
- Assets Initiating Private Network Connections: Traffic information whose source IP addresses are private IP addresses.
Procedure
- Log in to the management console.
- Click in the upper left corner of the management console and select a region or project.
- In the navigation pane, click and choose . The Dashboard page will be displayed, as shown in Figure 3.
- (Optional) If the current account has only one firewall instance, the firewall details page is displayed. If there are multiple firewall instances, click View in the Operation column to go to the details page.
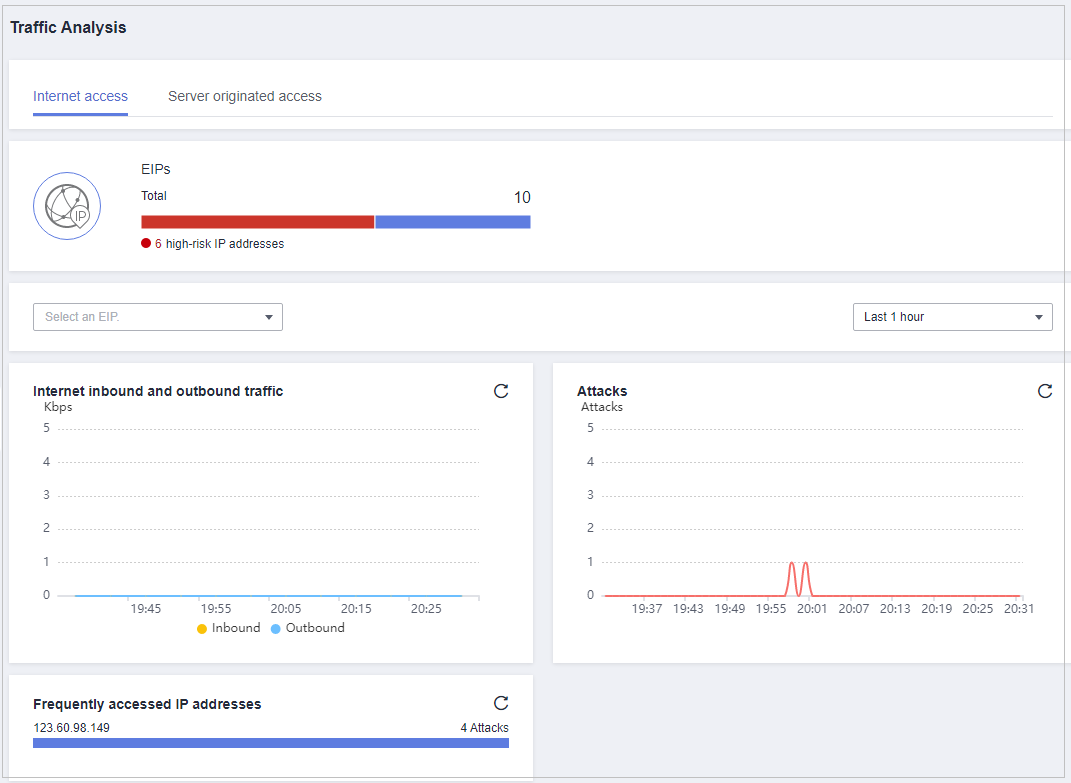
- In the navigation pane, choose Traffic Analysis. On the displayed page, you can click the following tabs to view details:
- Internet Access: the total inbound and outbound Internet traffic, attack trend, and top 10 access IP addresses in different time ranges, as shown in Internet access. For more information, see Internet access parameters.
- Server Originated Access: the inbound and outbound traffic of server originated access and the attack trend in different time ranges, as shown in Server originated access. For more information, see Server originated access parameters.
Table 3 Internet access parameters Parameter
Description
EIPs
Total EIPs. They are categorized as follows:
- High-risk IP addresses are not protected and displayed in red.
- Protected IP addresses are displayed in blue.
Internet inbound and outbound traffic
Statistics on Internet inbound and outbound traffic
Attacks
Number of attacks at different time segments.
Frequently accessed IP addresses
Top 10 EIPs with the highest access rates detected by CFW.

Feedback
Was this page helpful?
Provide feedbackThank you very much for your feedback. We will continue working to improve the documentation.


