
Billing Items
Billing Description
You will be billed based on reported custom metrics. For details, see Table 1. For AOM 2.0, basic metrics are free of charge, but reported custom metrics are not.
| Billing Item | Description | Price |
|---|---|---|
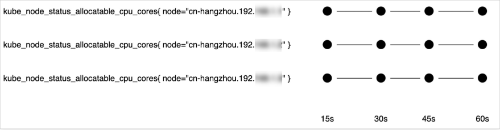
| Reported custom metrics | The number of reported custom metrics refers to the number of sampling points. It is calculated based on the open-source Prometheus data model. A sampling point data record contains the metric name, label set, sampling timestamp, and value. Sampling points are logically organized on a time line. For example, the kube_node_status_allocatable_cpu_cores metric monitors the number of CPU cores that can be allocated to each node in a Kubernetes cluster. If your cluster contains three nodes, the sampling points are distributed on three different timelines. If the sampling period of each node is 15s, the total number of reported sampling point data records within 1 minute can be calculated as follows: 3 x (60/15) = 12.
Scenarios where custom metrics are reported: Why Are Additional Fees Incurred After Prometheus Instances Are Connected? |
|
Billing Examples
The following uses reported custom metrics as an example. The prices mentioned in the following are only for reference. For details, see Price Calculator.
Assume that you have one server and 800 million metrics are reported every day. You will be billed based on three price ranges. The fee is calculated as follows:
- 0–150 million metrics: $0.1 USD × 150
- 150–600 million metrics: $0.07 USD × 450
- 600–1,200 million metrics: $0.05 USD × 200
Total daily fee: $0.1 USD × 150 + $0.07 USD × 450 + $0.05 USD × 200 = $56.5 USD
Feedback
Was this page helpful?
Provide feedbackThank you very much for your feedback. We will continue working to improve the documentation.


