Viewing the HetuEngine Instance Monitoring Page
On the HetuEngine web UI, you can view the detailed information about a specified service, including the execution status of each SQL statement.
Procedure
- Log in to FusionInsight Manager as an administrator who can access the HetuEngine web UI and choose Cluster > Name of the desired cluster > Services > HetuEngine. The HetuEngine service page is displayed.
- In the Basic Information area on the Dashboard tab page, click the link next to HSConsole WebUI. The HSConsole page is displayed.
- Click Compute Instance then the tenant name corresponding to the instance to which operations are to be performed.
- Click LINK in the WebUI column to access the compute instance task monitoring page. If you access the CLUSTER OVERVIEW page for the first time, you can view information on the compute instance task monitoring page.
Table 1 Metric description Metric
Description
Running Queries
Indicates the number of tasks concurrently executed on the current instance.
Active Workers
Indicates the number of valid worker nodes on the current instance.
ROWS/SEC
Indicates the number of data rows processed by the current instance per second.
Queued Queries
Indicates the number of tasks to be executed in the waiting queue on the current instance.
RUNNABLE DRIVERS
Indicates the number of running drivers on the current instance.
BYTES/SEC
Indicates the amount of data read from the current instance per second.
Blocked Queries
Indicates the number of blocked tasks on the current instance.
RESERVED MEMORY (B)
Indicates the memory occupied by running tasks on the current instance.
WORKER PARALLELISM
Indicates the average CPU time slice used by each worker on the current instance per second.
Avg CPU cycles per worker
Indicates the average CPU cycles of each worker node of the current instance.
- Filter query tasks by State on the QUERY DETAILS page.
Table 2 State description State
Description
Running
Views running tasks.
Queued
Views the tasks to be executed in the waiting queue.
Finished
Views the finished tasks.
Failed
Views failed tasks, which can be filtered by failure cause.
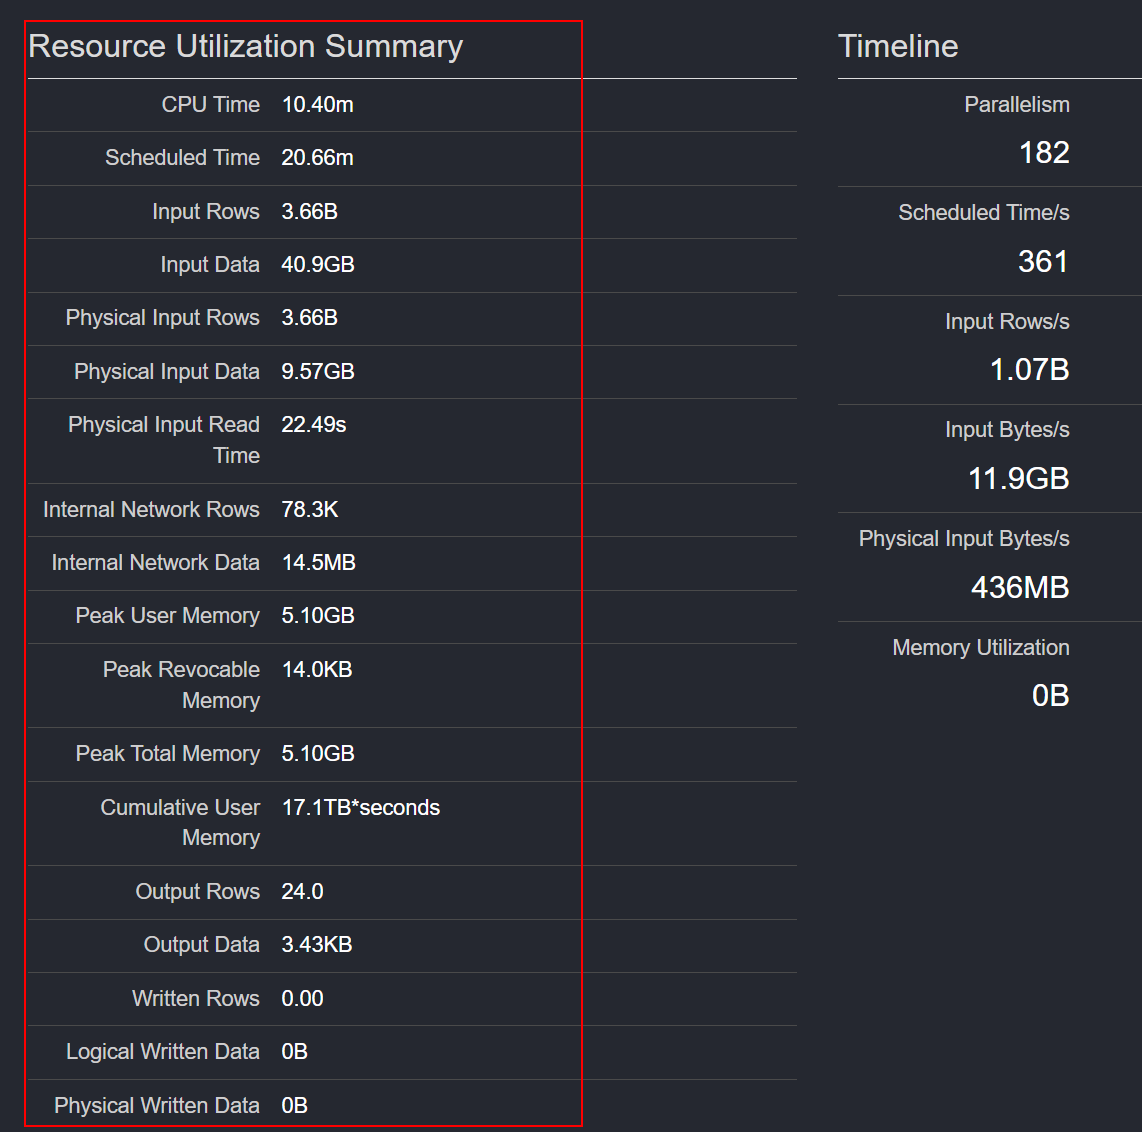
- Click a task ID to view the basic information, resource usage, stages, and tasks. For a failed task, you can view related logs on the detail query page.
Figure 1 Viewing task details
 Figure 2 Task resource utilization summary
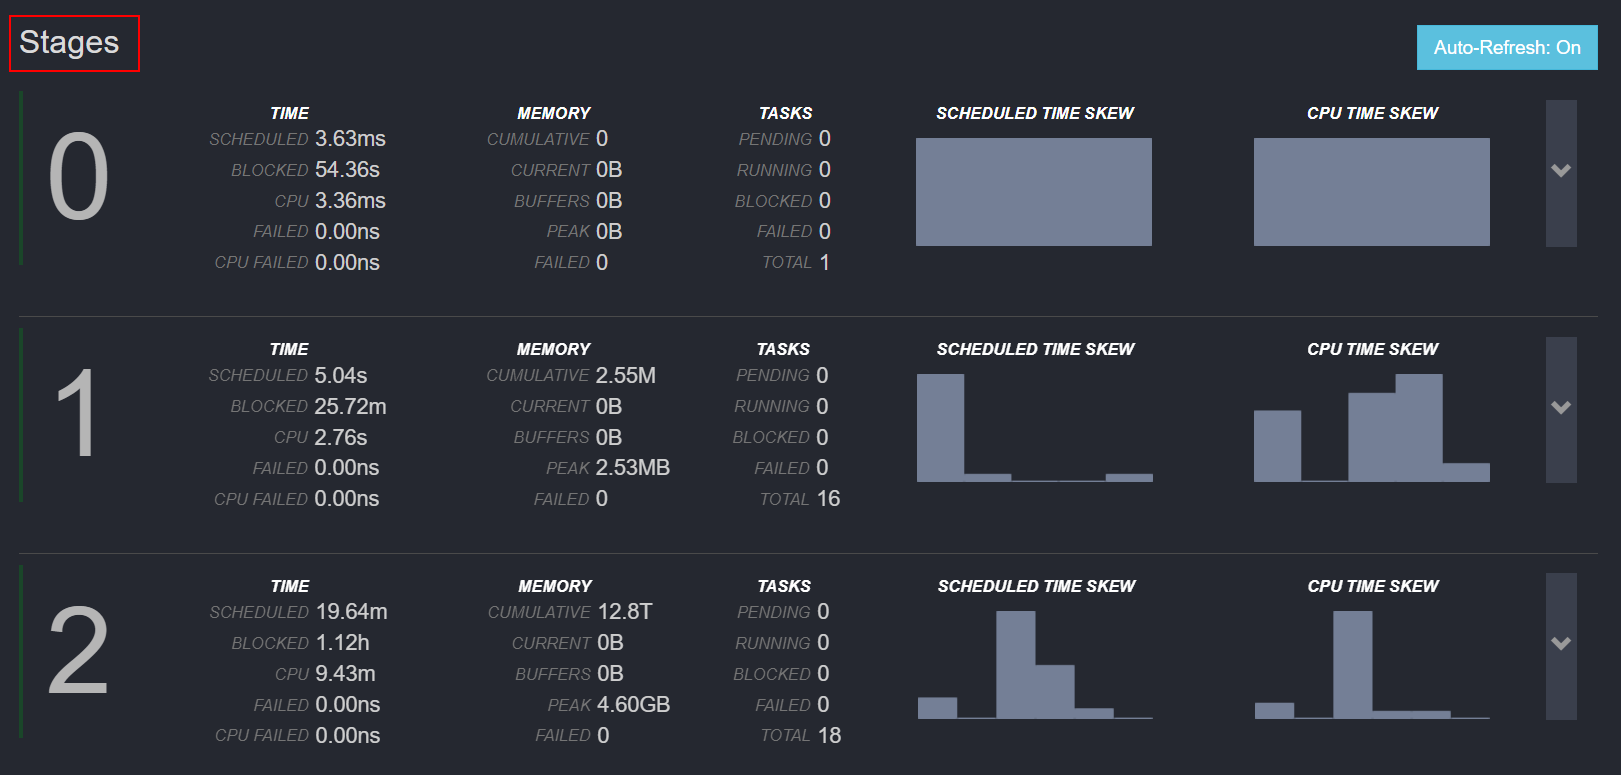
 Figure 3 Stages
Table 3 Stages monitoring information Monitoring Item
Description
SCHEDULED TIME SKEW
Indicates the scheduled time of the concurrent tasks on a node in the current stage.
CPU TIME SKEW
Indicates whether concurrent tasks have computing skew in any stage phase.
Figure 4 Tasks (Clicking the triangle on the right of each stage to view the tasks)
Table 4 Tasks monitoring items Monitoring Item
Description
ID
Indicates the ID of the task that is concurrently executed in multiple phases. The format is Stage ID:Task ID.
Host
Indicates the Worker node where the current task is being executed.
State
Indicates the task execution status, including PLANNED, RUNNING, FINISHED, CANCELED, ABORTED, and FAILED.
Rows
Indicates the total number of data records read by a task. The unit is thousand (k) or million (M). By analyzing the number of data records read by different tasks in the same stage, you can quickly determine whether data skew occurs in the current task.
Rows/s
Indicates the number of data records read by a task per second. By analyzing the number of data records read by different tasks in the same stage, you can quickly determine whether the network bandwidth of the node is different and whether the node NIC is faulty.
Bytes
Indicates the data volume read by a task.
Bytes/s
Indicates the data volume read by a task per second.
Elapsed
Indicates the task execution duration.
CPU Time
Indicates the CPU time used by a task.
Mem
Task memory
Peak Mem
Peak memory usage of tasks
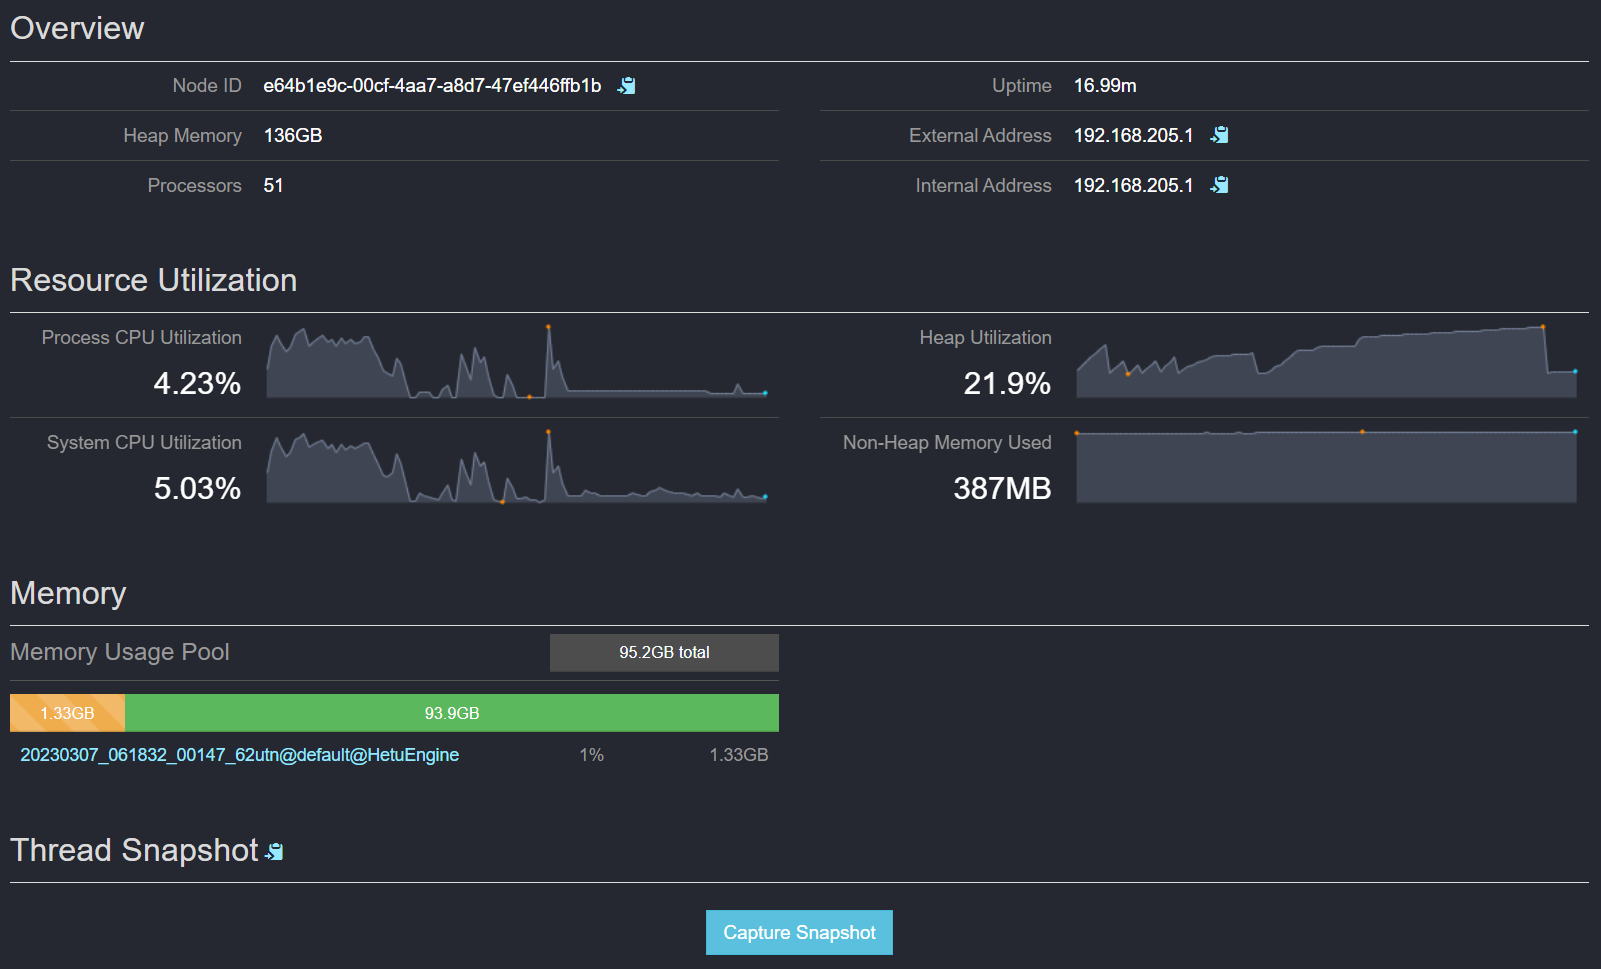
- Click the "Host" link to view the task resource usage of each node.
Figure 5 Resource usage of the Task node

Table 5 Monitoring metrics of node resources Name
Description
Node ID
Indicates the host ID.
Heap Memory
Indicates the maximum heap memory size.
Processors
Indicates the number of processors.
Uptime
Indicates the running duration.
External Address
Indicates the external IP address.
Internal Address
Indicates the internal IP address.
Process CPU Utilization
Indicates the physical CPU utilization.
System CPU Utilization
Indicates the system CPU utilization.
Heap Utilization
Indicates the heap memory utilization.
Non-Heap Memory Used
Indicates the non-Heap memory size.
Memory Usage Pool
Indicates the memory pool size of the current Worker node.
Feedback
Was this page helpful?
Provide feedbackThank you very much for your feedback. We will continue working to improve the documentation.


